Week 3 - Solving second order ODEs
INTRODUCTION:- In Engineering, ODE is used to describe the transient behavior of a system. A simple example is a pendulum
The way the pendulum moves depends on the Newtons second law. When this law is written down, we get a second order Ordinary Differential Equation that describes the position of the "ball" w.r.t time.
Similarly, there are hundreds of ODEs that describe key phenomena and if you have the ability to solve these equations then you will be able to simulate any of these systems.
Your objective is to write a program that solves the following ODE. This ODE represents the equation of motion of a simple pendulum with damping.
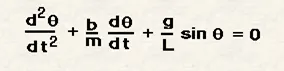
In the above equation:-
g = gravity in m/s2,
L = length of the pendulum in m,
m = mass of the ball in kg,
b=damping coefficient.
CHALLENGE:- To write a program to stimulate the simple pendulum motion. The values of the inputs are given for damping coefficient, gravity, length of the pendulum, and mass of the ball.
As shown in the video the derivation for code simplification is mentioned.
Theta 1 = angular displacement of the pendulum ball.
Theta 2= angular velocity of the pendulum ball.
CODE:- The code below is the main code for the program:-
clear all
close all
clc


%(b)damping coefficient, (g)gravity, (l)length of the string, (m)mass of
%the ball.

b=0.05
g=9.81
l=1
m=1

%initial condition
theta_0=[0;3];

% time point
t_span=linspace(0,20,500);

%solve ODE
[t, results] = ode45(@(t,theta) ode_func(t, theta, b,g,l,m),t_span, theta_0);

figure(1)
%ploting angular displacement and angular velocity
plot(t,results(:,1),'linewidth',1,'color','b')
hold on
plot(t,results(:,2),'linewidth',1,'color','r')
xlabel('time')
ylabel('plot')

title('displacement and velocity w.r.t time')

%Animating the transient motion of the simple pendulum

ct=1;
for i=1:length(results(:,1))
    x0=0;
    y0=0;

    x1=l*sin(results (i,1));
    y1=-l*cos(results(i,1));

    figure(2)
   plot([-1,1],[0,0],'linewidth',3,'color','b');
   line([x0 x1],[y0 y1],'linewidth',4,'color','g');
   hold on
   plot(x1,y1,'O','markers',20,'markerfacecolor','r');
   axis([-1.5 1.5 -1.5 0.5]);
   grid on
    pause(0.01);
    M(ct)=getframe(gcf);
    hold off
    ct=ct+1;

end
%Animation of motion of simple pendulum.
 movie(M)
 videofile = VideoWriter('Simple_Pendulum.avi','Uncompressed AVI');
 open(videofile)
 writeVideo(videofile,M)
 close(videofile)
- The above program starts with the code of clear all, close all, clc.
- Then the given inputs values of b, g, l ,m and initial condition of theta is provided that is 0,3
- The time span is taken to be 20 sec with 500 equal intervals for the motion of the simple pendulum ‘t_span’.
- An ODE function code is written to establish the relation between the input values provided in the main code for second-order ODE. The following function code is written as:-
function [dtheta_dt] = ode_func(t,theta,b,g,l,m)

theta1=theta(1)
theta2=theta(2)
dtheta1_dt=theta2;
dtheta2_dt= -(b/m)*theta2 - (g/l)*sin(theta1);
dtheta_dt = [dtheta1_dt; dtheta2_dt];
end- In the above program, it is written to solve the ODE in Matlab. Then all the relation and corresponding equation are entered, which is to be called on to the main code.
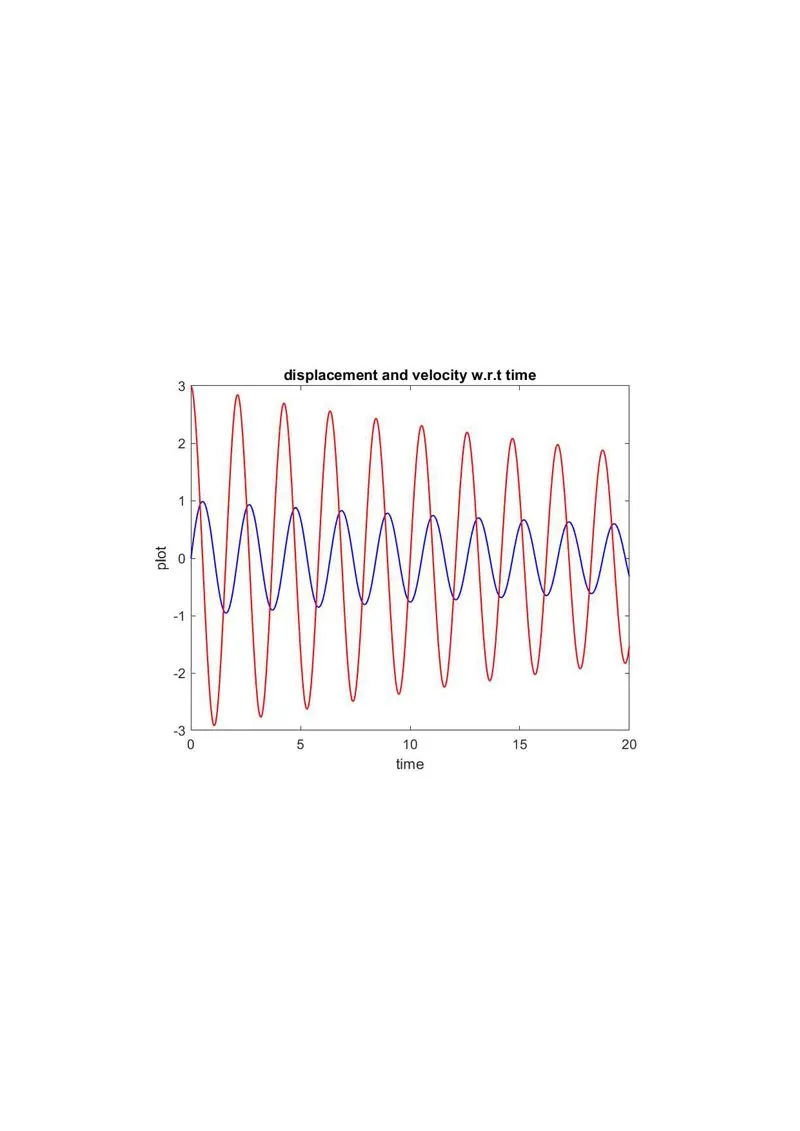
5. (t, results) are the results which required to be plotted with respect to the time in which angular displacement and angular velocity plots were created for a time span of 20 sec.
6. The results are used to get a graph of angular displacement and angular velocity.
7. After getting the plot, Counter(ct) is used for the increment for a variable, which represents each and every frame
8. Now for changing the values of degrees of theta, the for loop command is used. In the given program for loop { i=1:length(results(:,1)} which means the value of ‘I’ varies from 1 to the given no. of theta. The coordinates of the points of line (x0, y0 ,x1 ,y1) and their corresponding relations are provided so that string of the pendulum can be formed. For bob or a ball of a pendulum, a marker command is used.
9. Pause command is used to pause the code at every(0.01) in sec. Thus the ‘pause’ command is used to get the better animation for the pendulum.
10. After the pause command the ‘getframe’ command is used to capture the motion and stored in the variable M.
11. The next step will to make a movie of animation created by using the ‘movie’ command. For creating the movie first we have to given the array called ‘M’ which is to get all the individual frames. The command M(ct)=getframe(gcf) means to the figure window which is assigned to an array ‘M’
12. Matlab will generate a move with all the frames movie(M) and the format of the videofile is of avi. Then we have to open the videofile, then writevideo file as ‘M’ and then close it.
RESULTS:- The output obtained is a graphical representation of angular displacement and angular velocity generated for a time range of 20 sec.
Below is the youtube link for the animation of simple pendulum:-
ERROR FACED :-
- The spelling mistake is done in writing the function. by checking thoroughly in line 21 as shown by the matlab. “od45” was written instead of “ode45”
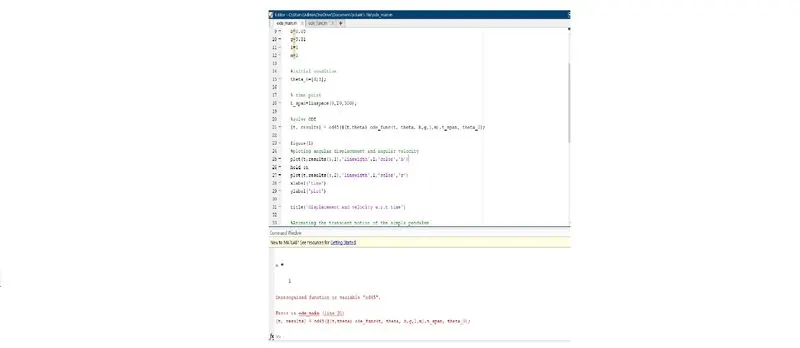
- A wrong command was applied for the ball or bob of the pendulum which is written below:-
{plot(x1,y1,'0','markers',20,'markerfacecolor','r'}The correct command for bob is “o” not “0”zero, which was rectified.