Week 3 - Solving second order ODEs
Step 1: Creating an ODE function.
therefore writing these formulas into Matlab as a function of an ODE. The function is given below,
function [dtheta_dt] = ode_func(t,theta,b,g,l,a)
theta1 = theta(1)
theta2 = theta(2)
dtheta_dt = theta2;
dtheta2_dt = -(b/m)*theta2 - (g/1)*sin(thetaa1);
dtheta_dt = [dtheta_dt; dtheta2_dt];
end
Step 2: Writing a code to oscillate the pendulum.
Defining the initial values,
Inputs:
- L=1 metre,
- m=1 kg,
- b=0.05.
- g=9.81 m/s2.
Initial conditions:
- Simulating the motion between 0-20 sec, for angular displacement=0,angular velocity=3 rad/sec at time t=0
- When I did this I got the position of the pendulum as a function of time. Thus I wrote the code to plot the graph as well as to simulate the pendulum according to the graph:
- Angular Displacement(theta) v/s Time
- Angular Velocity v/s Time.
Step 2: The program are as follows,
clear all
close all
clc
% inputs
b = 0.05; % Damping coefficient
g = 9.81; % Gravity m/s^2
m = 1; % mass of pendulam in kg
l = 1; % length of the string attached to pendulamin meters
% initial conditions
theta_0 = [0;3]; %[angular displacement=0;angular velocity=3]
%time points
t_span = linspace(0,20,500); %pendulum oscillates between 0-20 seconds
%solve result
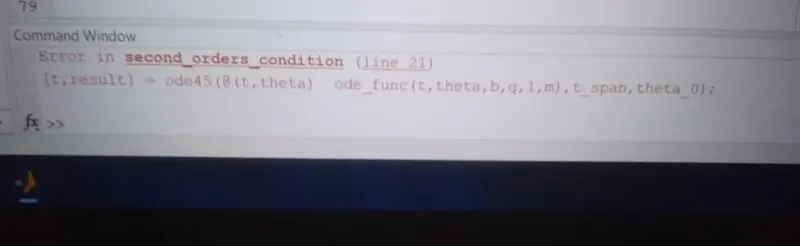
[t,result] = ode45(@(t,theta) ode_func(t,theta,b,g,l,m),t_span,theta_0);
%plotting the graph
figure(1)
subplot(2,1,1)
p1 = plot (t,result(:,1),'linewidth',2,'color','b')
xlabel('Time')
ylabel('Theta')
title('Angular Displacement(theta) v/s Time')
legend([p1(1),p2(1)],'angular displacement','angular velocity')
hold on
subplot(2,1,2)
p2 = plot(t,result(:,2),'linewidth',2,'color','r')
xlabel('Time')
ylabel('Velocity')
title('Angular Velocity v/s Time')
legend([p1(1),p2(1)],'angular displacement','angular velocity')
%pendulum simulation using ode
theta = result(:,1)
ct=1;
%%creating a for loop for oscillating the pendulum
for i=1:length(result)
THETA = result(i,1);
%initial boundary conditon
x0=0;
y0=0;
%Defining x and y coordinates
x1= l*sin(THETA);
y1= -l*cos(THETA);
figure(2)
hold on
plot([x0 x1],[y0 y1],'linewidth',4);
plot(x1,y1,'-o','markersize',30,'markeredgecolor','g','markerfacecolor',[0.6 0.6 0.6]);
plot(x0,y0,'-*','markersize',3,'markeredgecolor','g','markerfacecolor',[0.6 0.6 0.6]);
axis([-2 2 -2 0]);
pause(0.005);
M(ct)=getframe(gcf)
ct=ct+1;
clf() %clf() code is used for clearing the current graphic image
end
%%creating the animation and movie(avi)
movie(M);
videofile = VideoWriter('second_ode_pendulum.avi','uncompressed AVI');
open(videofile)
writeVideo(videofile,M)
close(videofile)
Output:
- A motion of Pendulum:
2. Graph:
https://youtube.com/shorts/_T-zrHMzG5s.
Error and solution:
there are many errors occurs while generating loop for animation.
The main cause of error i faced is a typo which was \"results(i:1)\" which is not correct.
the correct form for this program is \"results(i,1)\".
I faced many more error because typo\'s in creating animation in octave.