Week 3 - Solving second order ODEs
Aim : Simulate motion of simple pendulum by solving ODE using Python
Code :
import numpy as np
from scipy.integrate import odeint
import matplotlib.pyplot as plt
import math

# Function that returns dz/dt
def model(theta,t,b,g,l,m) :

	theta1 = theta[0]
	theta2 = theta[1]
	dtheta1_dt = theta2
	dtheta2_dt = -(b/m)*theta2 - (g/l)*math.sin(theta1)
	dtheta_dt = [dtheta1_dt, dtheta2_dt]
	return dtheta_dt

#input
b= 0.05 #damping coeff
g = 9.81  #acc due to gravity
l = 1  #length of pendulum
m = 1  #mass of ball at end of pendulum

#initial condition
theta_0 = [0,3]

#time points
t = np.linspace(0,20,150)

# solve ode
theta = odeint(model,theta_0,t,args = (b,g,l,m))

#plot result
plt.plot(t,theta[:,0],"b-",label=r'$\frac{d\theta_1}{dt}=\theta2$')
plt.plot(t,theta[:,1],'r--',label=r'$\frac{d\theta2}{dt}=-\frac{b}{m}\theta_2-\frac{g}{L}sin\theta_1$')
plt.ylabel("plot")
plt.xlabel("time")
plt.xlim(0.10)
plt.legend(loc= "best")
plt.show()

#animation
anim1 = []
for i in theta[:,0] :
	anim1.append(i)

ct = 1
for anim2 in anim1 :
	x0 = 0
	y0 = 0

	x1 = l*math.sin(anim2)
	y1 = -l*math.cos(anim2)

	filename = "Pendu%05d.png"%ct
	ct = ct + 1

	plt.figure()

	plt.plot([-0.2,0.2],[0,0]) #fix support
	plt.plot([x0,x1],[y0,y1]) #length string
	plt.plot(x1,y1, "-o")  # bob
	plt.xlim([-2,2])
	plt.ylim([-2,2])
	plt.savefig(filename)
Error encountered :
wrong gif because i forgot to add plt.figure()
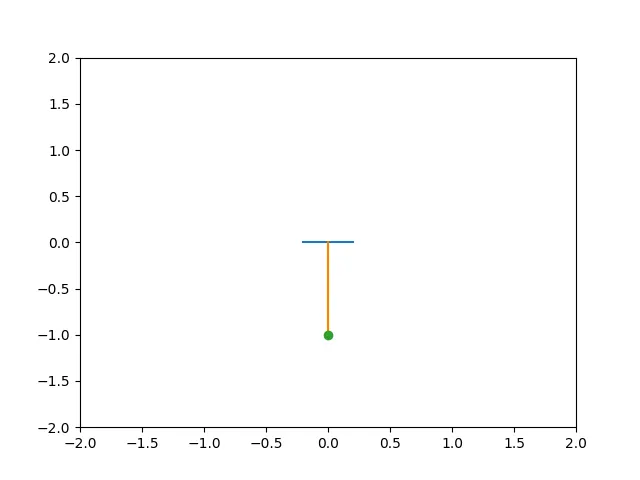
Correct results :
Animation :
Plot :
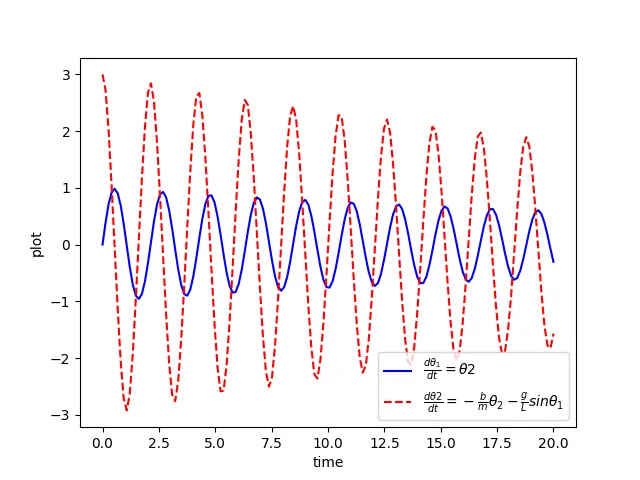
Plot can be improved by increasing xlim or increasing damping coefficient
Result : Motion of a simple pendulum was simulated through solving 2nd order ODE in python.