Week 3 - Solving second order ODEs
The equation given is a second order ODE, i.e.,
`(d^2theta)/dt^2 + b/m (d theta)/dt + g/L sin theta = 0`
hence this equation can be written as,
`(d^2 theta)/dt^2 = -b/m (d theta)/dt - g/L sin theta` ...eqn(1)
This eqaution is converted in 1st order ODE.
`theta_1 = theta(1)` --> this term indiactes displacement ...eqn(2)
`dot theta = theta (2)` -->this term indiactes velocity ...eqn(3)
`ddot theta = (d dot theta)/dt = (d^2 theta)/dt^2` ...eqn(4)
now substituting equation (2), (3) and (4) in equation (1), we have
`ddot theta = - b/m theta_2 - g/L sin(theta_1)` ...eqn(5)
from equation (3) and (5), we have
`dot theta = theta (2)`
`ddot theta = - b/m theta_2 - g/L sin(theta_1)`
we can observe that second order differential equation into 2 1st order ODE.
This ODE is written as a function which generates two output. The 1st column represnts the displacement and the second column represents the velocity. These values are plotted on a graph with x-axis represents the time.
The boundary conditions assigned to the problem is:
Length L = 1m
Mass m = 1kg
g = 9.81 m/s^2
damping coefficient b = 0.5 [higher value of damping coefficient is used because we can observe a smooth graph with better damping]
PYTHON PROGRAM:
import numpy as np
from scipy.integrate import odeint
import matplotlib.pyplot as plt
import math
import os
import shutil
import imageio


# function that returns dz/dt
def model(theta, t, b, g, l, m):
    theta1 = theta[0]
    theta2 = theta[1]
    dtheta1_dt = theta2
    dtheta2_dt = -(b / m) * theta2 - (g / l) * math.sin(theta1)
    dtheta_dt = [dtheta1_dt, dtheta2_dt]
    return dtheta_dt


b = 0.5
g = 9.81
l = 1
m = 1

# Initial Condition
theta_0 = [0, 3]

# Time plots
spacing = 300
t = np.linspace(0, 20, spacing)

# solve ODE
theta = odeint(model, theta_0, t, args=(b, g, l, m))


# Plot graphs of displacement and velocity with time
plt.plot(t, theta[:, 0], 'b-', label=r'$\frac{d\theta_1}{dt}=\theta_2$')
plt.plot(t, theta[:, 1], 'r--', label=r'$\frac{d\theta_2}{dt}=-\frac{b}{m}\theta_2-\frac{g}{l}sin\theta_1$')
plt.xlabel('time')
plt.ylabel('Amplitude')
plt.legend(loc='best')
plt.show()

# defining a circle
def createCircle(x1, y1):
    circle = plt.Circle((x1, y1), radius=0.05, fc='r')
    return circle

# filling the defined circle with a solid color
def showShape(patch):
    ax = plt.gca()
    shaded = ax.add_patch(patch)
    plt.axis('scaled')

    return shaded


# Plotting pendulum
ct = 1

# Extracting the working directory where the program is present
path = os.getcwd()
os.chdir(path)
new_path = 'pendulum_gif'
source = path
destination = path + "\\" + new_path
value = os.path.exists(destination)

# Checking if folder named "pendulum_gif" exists, if true deleting the folder
if value:
    shutil.rmtree("pendulum_gif")

# Creating a new folder named "pendulum_gif"
os.makedirs(new_path)

# Calculating the position of the pendulum
for value in theta[:, 0]:
    # Initializing start points for pendulum
    x0 = 0
    y0 = 0

    # Displacement of the pendulum
    x1 = l * math.sin(value)
    y1 = -l * math.cos(value)

    extra = len(str(spacing)) - len(str(ct))
    add = ''
    if extra > 0:
        for i in range(extra):
            add += '0'
            filename = 'pendulum_' + add + str(ct) + '.png'
    else:
        filename = 'pendulum_' + str(ct) + '.png'
    ct += 1

    # Plotting a graph of pendulum with every iteration and saving individual file with unique file name extension
    plt.figure()
    plt.plot([x0, x1], [y0, y1], 'black')
    c = createCircle(x1, (y1 - 0.045))
    showShape(c)
    plt.xlim([-1, 1])
    plt.ylim([-1.5, 0.5])
    plt.savefig(filename)

# Extracting the list of all files and saving in the variable
file_list = os.listdir(source)

# Moving the saved images into a new folder created - "pendulum_gif"
for files in file_list:
    check = os.path.splitext(files)
    if check[1] == '.png':
        if os.path.exists(files):
            shutil.copy(files, destination)
            os.remove(files)
        else:
            shutil.move(files, destination)


# Changing the current working directory to new working directory
os.chdir(destination)
files = os.listdir(destination)

# Merging all png files to create a .gif file
image_path = [os.path.join(destination, file) for file in files]
images = []
for img in image_path:
    images.append(imageio.imread(img))

imageio.mimwrite('pendulum.gif', images, fps=30)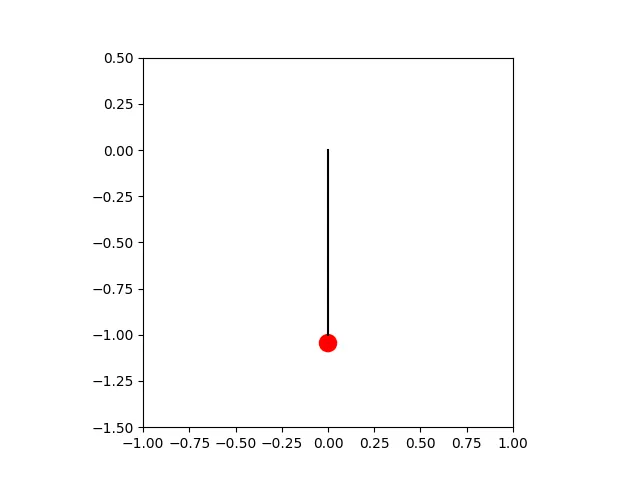
The video depects the oscillation of the pendulum having string length 1m, mass 1kg and b as 0.5.
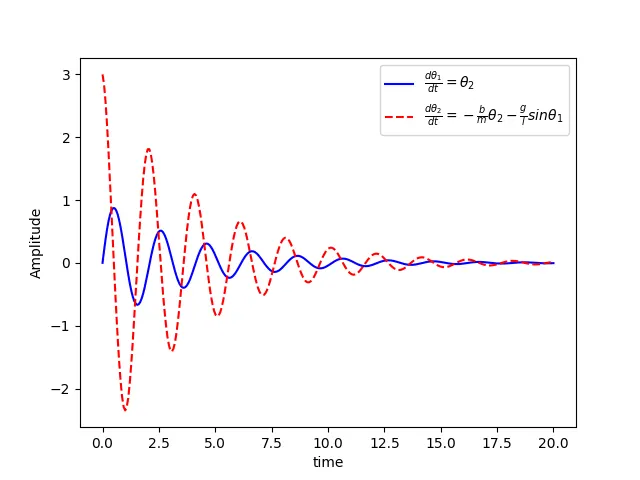
Damping obtained when b = 0.5