Week 3 - External flow simulation over an Ahmed body.
- Aim: To study the effects of flow over the Ahmed body and perform the grid independence test. The objectives are:
- Describe Ahmed's body and its importance.
- Explain the reason for the negative pressure in the wake region.
- Explain the significance of the point of separation.
- To generate Velocity and pressure contours.
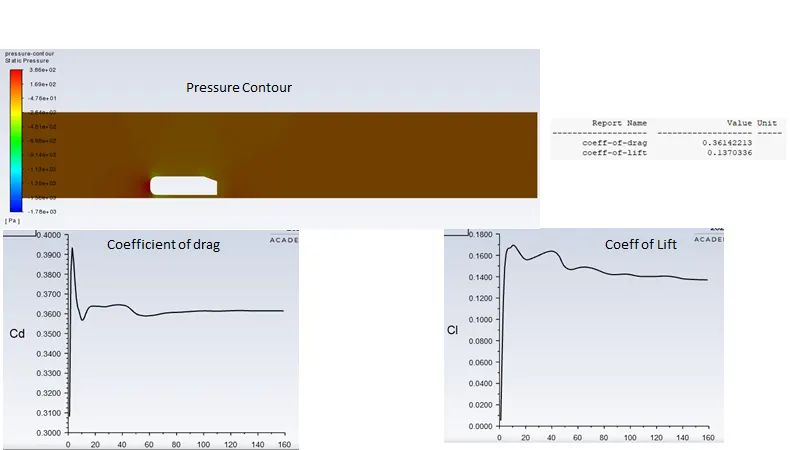
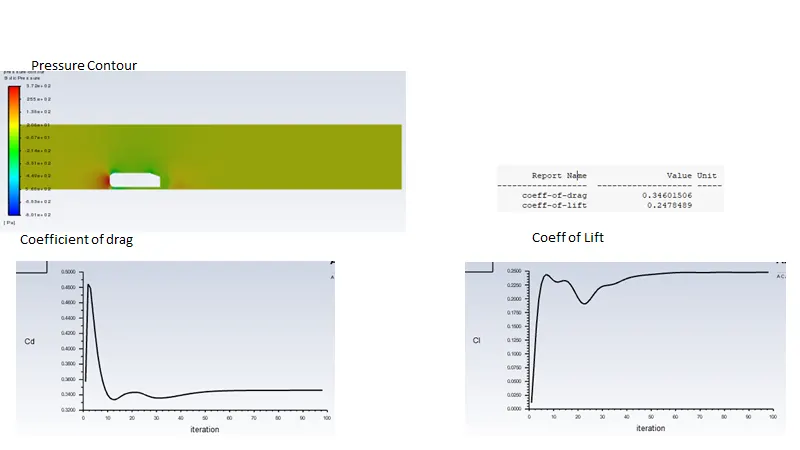
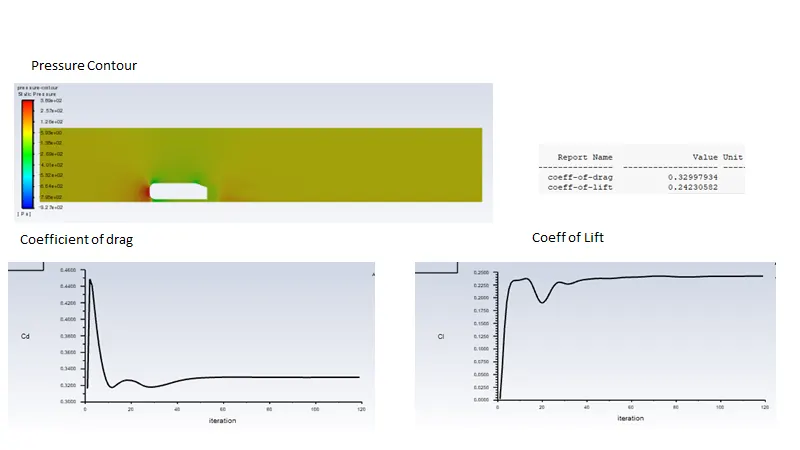
- To represent the drag coefficient plot for a refined case.
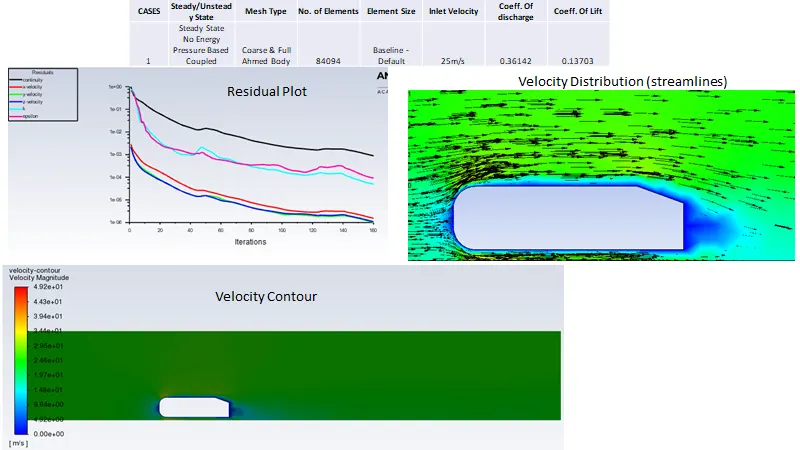
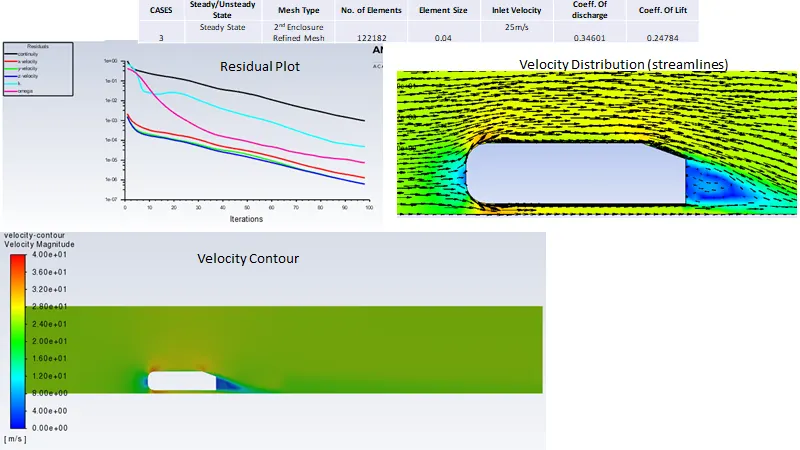
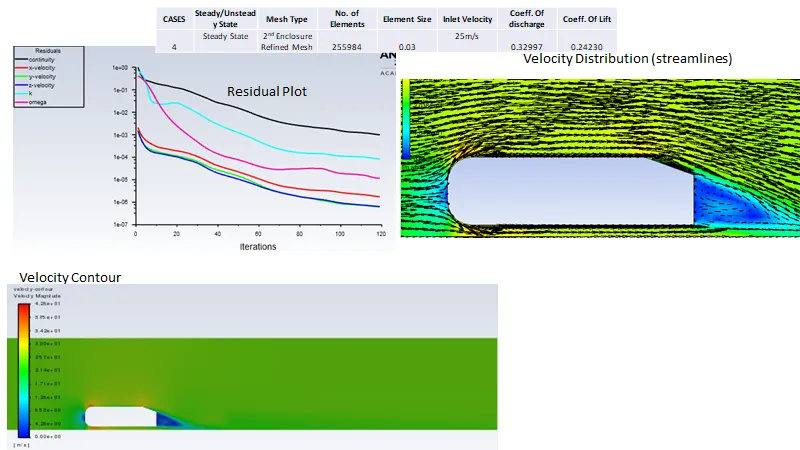
- To show the vector plot clearly showing the wake region.
- Perform the grid independency test and provide the values of drag and lift with each case.
- INTRODUCTION
Q1: Importance of Ahmed Body :
Ahmed body is considered as a generic car body. This was first defined and characterized in the experimental work of Ahmed as shown in figure below.
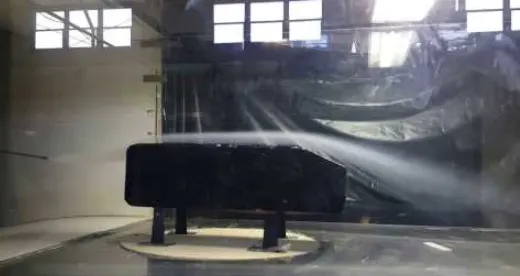
It is a benchmark model that is used in the automotive industry for validating simulation tools since it possesses a car like geometry features. The essential flow features around the geometry are captured by the air flowing around the Ahmed body. It is used in vehicle to validate the numerical model based on the experimental data from wind tunnel testing is available on Ahmed body. The validated numerical model is then used to design new models of the car. It also helps to study the recirculation regions formed behind a car and the effects of various other parameters on the automobile body.
Q2: Explain the reason for the negative pressure in the wake region?
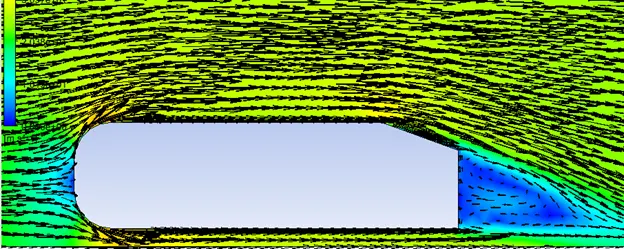
When a fluid flows around the vehicle there is a region of disturbed flow or turbulent downstream of vehicle. This is created due to the recirculation of the flow immediately behind the stationary or moving vehicle caused by viscosity which is in turn accompanied by flow separation and turbulence. The air that is moving around the vehicle is separated and it leaves a low pressure turbulent region called as wake.
Significance of the point of separation:
The point at which the velocity gradient changes from positive to negative value is known as the point of separation. At the point of separation, the velocity profile du/dy is equal to zero at the walls. The point of separation causes the wake flow which is contributor for the drag force. The closer the flow to the body lower the recirculation zone and hence reduces the effect of drag on the body. Closer flow maximize the efficiency of the body.
`P_(f) - P(i) = 0 - mv`
`F prop deltaP`
Three main features seen in wake :
- A recirculation region that is formed as the flow seaparates at the top of the vertical back surface of the model
- B Recirculation region that is formed de to the separation at the base of the model
- C-pillar vortices that forms as the vorticity in the side boundary layers roll up over the slant edges
- Procedure:
- Geometry preparation
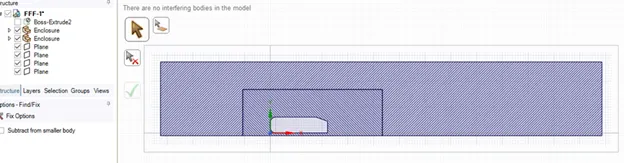
- IMPORT GEOMETRY IN SPACE CLAIM
- Mesh
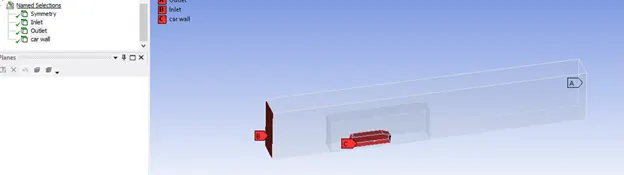
- OPEN MESH -->ENTITY SELECTION > FACE SELECTION--> select the faces of the geometry to be mentioned as boundaries NAMELY INLET X,INLETY,OUTLET AND WALLS
- Multizone Hexahedral Mesh
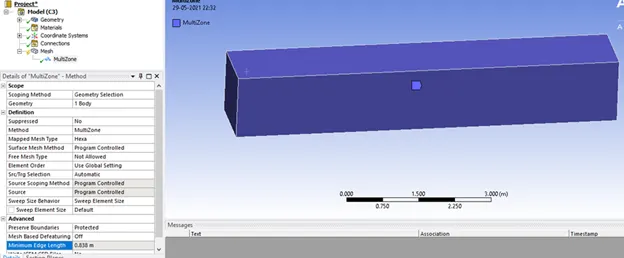
2nd Enclosure Tetrahedral Mesh
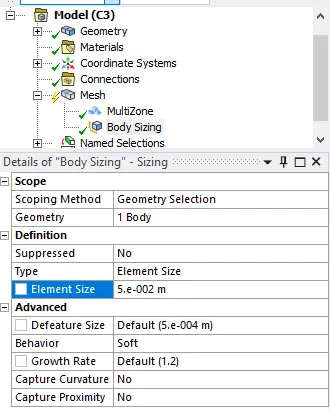
- Face meshing for pillars of Ahmed body
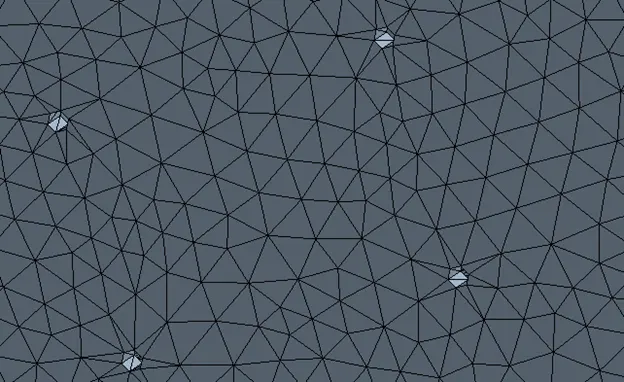
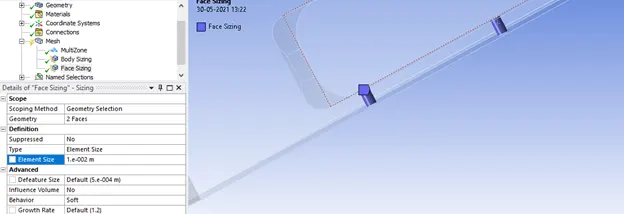
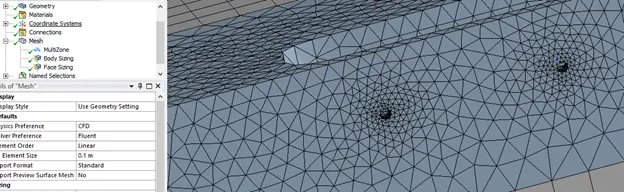
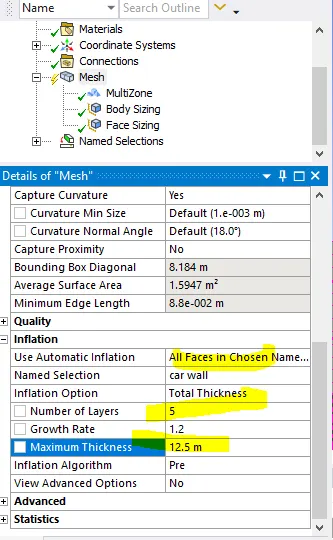
Inflation – 5 layers
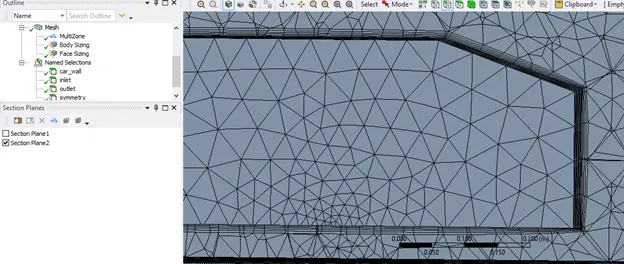
- QUALITY --> MESH METRIC --> ELEMENT QUALITY --> C GRAPH ( AS LONG AS ELEMENT QUANTITY is not lower than 5%, SIMULAION RUNS)
- Close the Mesh
- Set Up
- DOUBLE CLICK SETUP -- > FLUENT LAUNCHER -->DOUBLE PRECISION.
- Ansys Fluent is opened.
- In Graphics window --> GEOMETRY AND CONSOLE window is displayed.
- SETTING UP DOMAIN -->MESH --> select CHECK. Then in CONSOLE WINDOW --> it shows 'CHECKING MESH…. DONE'
- To Change the Units, SETTING UP DOMAIN --> click Units
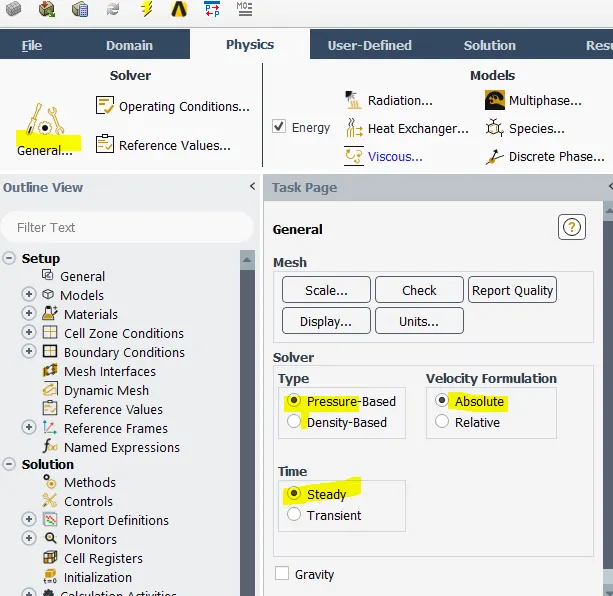
- SETTING UP PHYSICS --> SOLVER --> select Time = STEADY, Type = PRESSURE BASED & Velocity Formation = ABSOLUTE.
- SETTING UP PHYSICS à MODELS --> VISCOUS MODEL --> Model --> K-epsilon Model, REALIZABLE K-epsilon Model, STANDARD WALL FUNCTIONS -->OK.
- SETTING UP PHYSICS-->BOUNDARIES -->ASK PAGE opens. Enter the values for
- Inlet - Velocity Inlet - Velocity = 25 `ms^(-1)`
- Outlet - Pressure Outlet - Gauge pressure = 0
- Wall - Stationary outer wall of Ahmed Body
- Rest all faces - Symmetry
- Solution
- SOLVING --> CONTROLS, REPORTS, INITIALIZATION, RUN CALCULATION.
- REPORTS-- > DEFINITIONS --> NEW --> Forceà Coeff. Of Drag and Coeff. Of Lift
- CREATE --> select REPORT FILE and REPORT PLOT.
- INITIALIZATION --> select METHOD = HYBRID --> click t=0 INITIALIZE
- RUN CALCULATION --> NO. OF ITERATIONS =500 and press CALCULATE.
- Results and Discussion:
- Double click on RESULTS --> Post process window opens
- Plane Creation --> Top Toolbar --> INSERT-- > LOCATION --> PLANE
- Plane 1 --> Double click --> COLOR --> Mode = VARIABLE-- > In VARIABLE --> select Velocity - > Apply
- Vector à variable -> Velocity
CASE1
CASE2
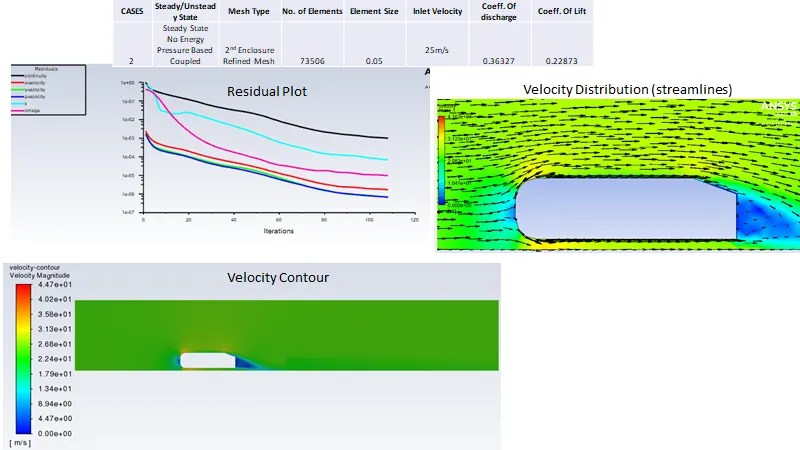
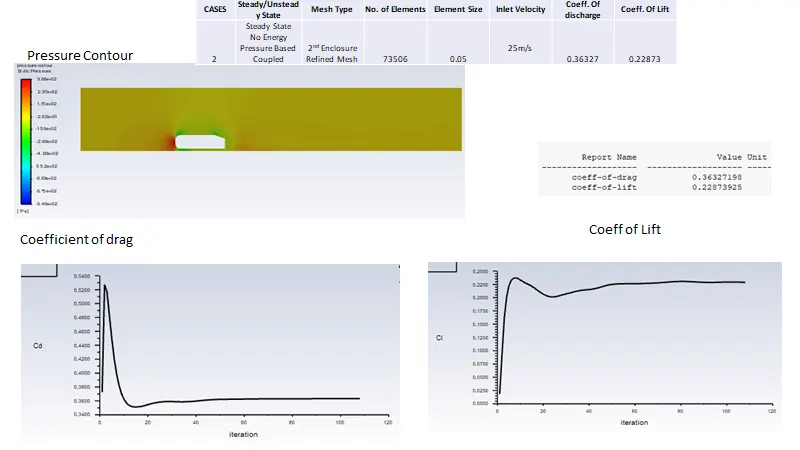
Inference: when the air flows towards the rear end a low pressure region is created behind the vehicle called a wake region as a result of negative pressure.
CASE3
CASE4
Summary Table
|
CASES |
Steady/Unsteady State |
Mesh Type |
No. of Elements |
Element Size |
Inlet Velocity |
Coeff. Of discharge |
Coeff. Of Lift |
|
1 |
Steady State |
Coarse & Full Ahmed Body |
84094 |
Baseline - Default |
25m/s |
0.36142 |
0.13703 |
|
2 |
Steady State |
2nd Enclosure Refined Mesh |
73506 |
0.05 |
25m/s |
0.36327 |
0.22873 |
|
3 |
Steady State |
2nd Enclosure Refined Mesh |
122182 |
0.04 |
25m/s |
0.34601 |
0.24784 |
|
4 |
Steady State |
2nd Enclosure Refined Mesh |
255984 |
0.03 |
25m/s |
0.32997 |
0.24230 |
Inference:
- Grid dependency test: It is envisaged from case 2,3 & 4 that after element size is less than 0.04` `C_(d)` is converged to the value of 0.33 approx, which is the desired value. Thus the Grid dependency test help to find the finest mesh suitable for Ahmed body
- Velocity and pressure contour plot for all the cases are plotted along with vector plot showing the wake region'
- The wake region becomes more explicit as the mesh is refined or finer with the trade off of more computation time.
- Veloicty distribution is also explicit and accurate as the mesh size is refined
- Coefficient of drag value depends on the reynolds number and y+ value for which the total thickness of the inflation layer is calculated.
- Separation point is observed when the fluid boundary layer encounters an adverse pressure gradient.This point on the body where the boundary layer lifts off surface is called separation point. For higher efficeinty the flow should be smooth and close to the surface.
Conclusion:
The steady state simulations to study the flow over ahmed body was successfully analysed using Ansys Fluent.