Week-3 Challenge: ADVISOR Tool
Aim: - 1. For EV_default_in file, if the cargo weight is 500 kg with all default conditions, can the vehicle travel for 45km with FTP drive cycle? Conclude your observations.
2. In the above case, we can try changing the battery capacity and repeat the simulation.
- Perform gradeability test with PRIUS_Jpn_default_in file. Compare your results in the table and conclude.
Theory: -
ADVISOR, NREL’s Advanced Vehicle Simulator, is a set of model, data, and script text files for use with Matlab and Simulink. It is designed for rapid analysis of the performance and fuel economy of conventional, electric, and hybrid vehicles. ADVISOR also provides a backbone for the detailed simulation and analysis of user-defined drivetrain components, a starting point of verified vehicle data and algorithms from which to take full advantage of the modelling flexibility of Simulink and analytic power of MATLAB.
The benefit of using ADVISOR:
- estimate the fuel economy of vehicles that have not yet been built
- learn about how conventional, hybrid or electric vehicles use (and lose) energy throughout their drivetrains
- compare relative tailpipe emissions produced on a number of cycles
- evaluate an energy management strategy for your hybrid vehicle’s fuel converter
- optimize the gear ratios in your transmission to minimize fuel use or maximize performance, etc.
The models in ADVISOR are:
- mostly empirical, relying on drivetrain component input/output relationships measured in the laboratory, and
quasi-static, using data collected in steady-state (for example, constant torque and speed) test and correcting them for transient effects such as the rotational inertia of drivetrain components
ADVISOR uses three primary graphical user interface
(GUI) screens to guide the user through the simulation
process. With the GUIs, the user can iteratively evaluate the
impacts of vehicle parameters and drive cycle requirements
on vehicle performance, fuel economy, and emissions.
The GUIs facilitate interaction with the raw input and output
data that is present in the MATLAB workspace. The vehicle
model is depicted graphically using Simulink block diagrams to define the connections between components. The
model then reads the input data from the MATLAB workspace during the simulation and outputs the results to the
workspace to be viewed in the results window
Procedure to launch advisor tool
- Launch MATLAB and set the default folder to the advisor.
- Now in the command window of MATLAB type ‘advisor’ and press enter
- A popup window will appear. Set the units to metric and start ADVISOR.
- A new window will launch showing vehicle parameters.
Solution 1: - For EV_default_in file, if the cargo weight is 500 kg with all default conditions, can the vehicle travel for 45km with FTP drive cycle?. Conclude your observations.
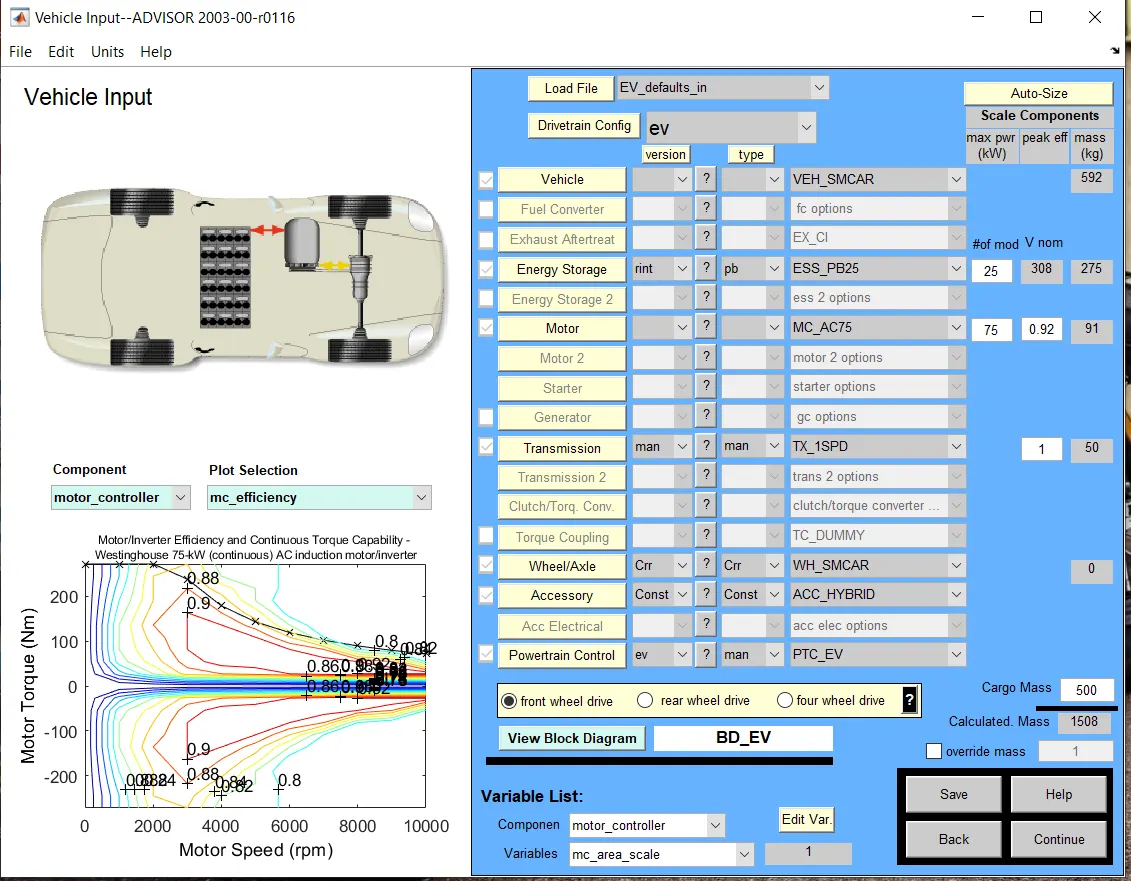
Step 1: - The EV_default_in is to be loaded from the drop-down menu and change drivetrain configuration from parallel to EV_default_in.
Step2: - Change the cargo weight to 500 kg. The calculated mass changes to 1350 kg
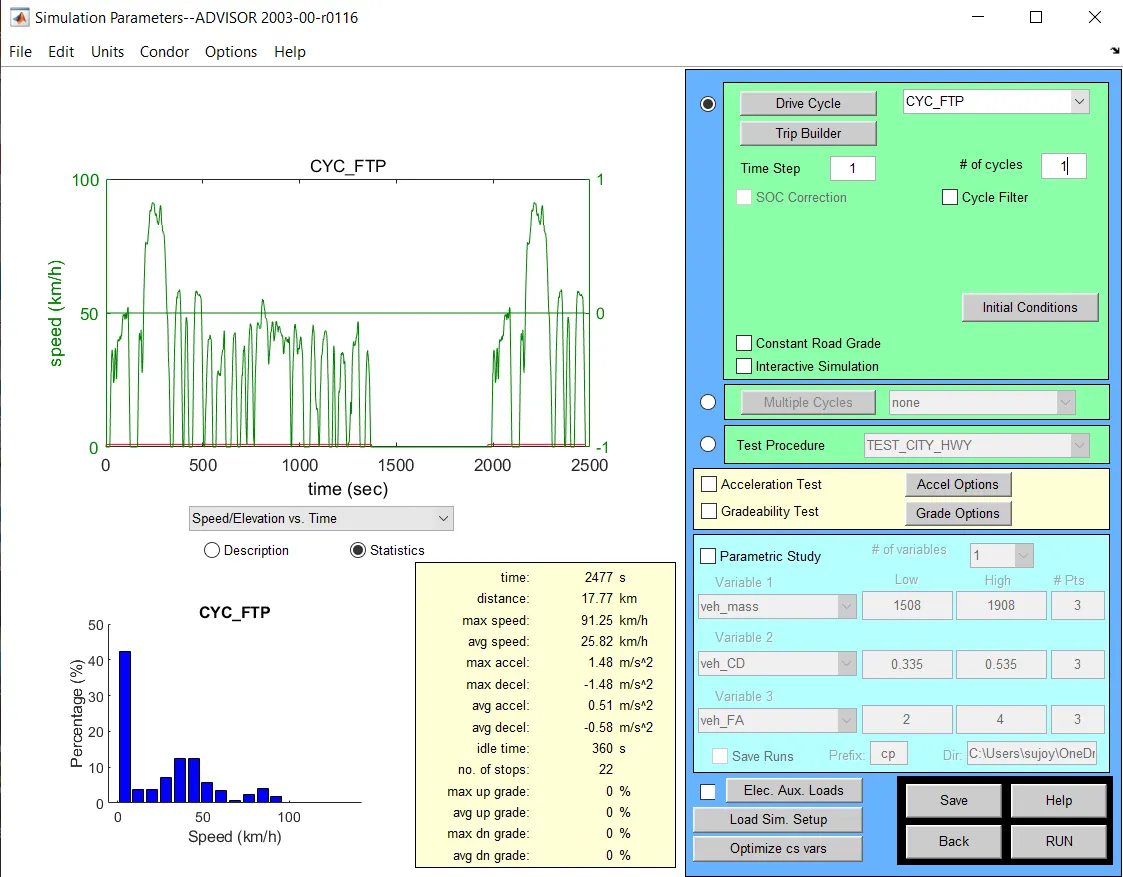
Step3: - Click continue to run the simulation. A new window will popup. The window helps to select the drive cycle and the number of cycles to run.
Step4: - Change drive cycle to CYC_FTP from the drop-down menu. Below the menu, we see #of cycles where we can change the number of drive cycles to run for simulations.
Step 5: - After the simulation is run a new window will open stating the results.
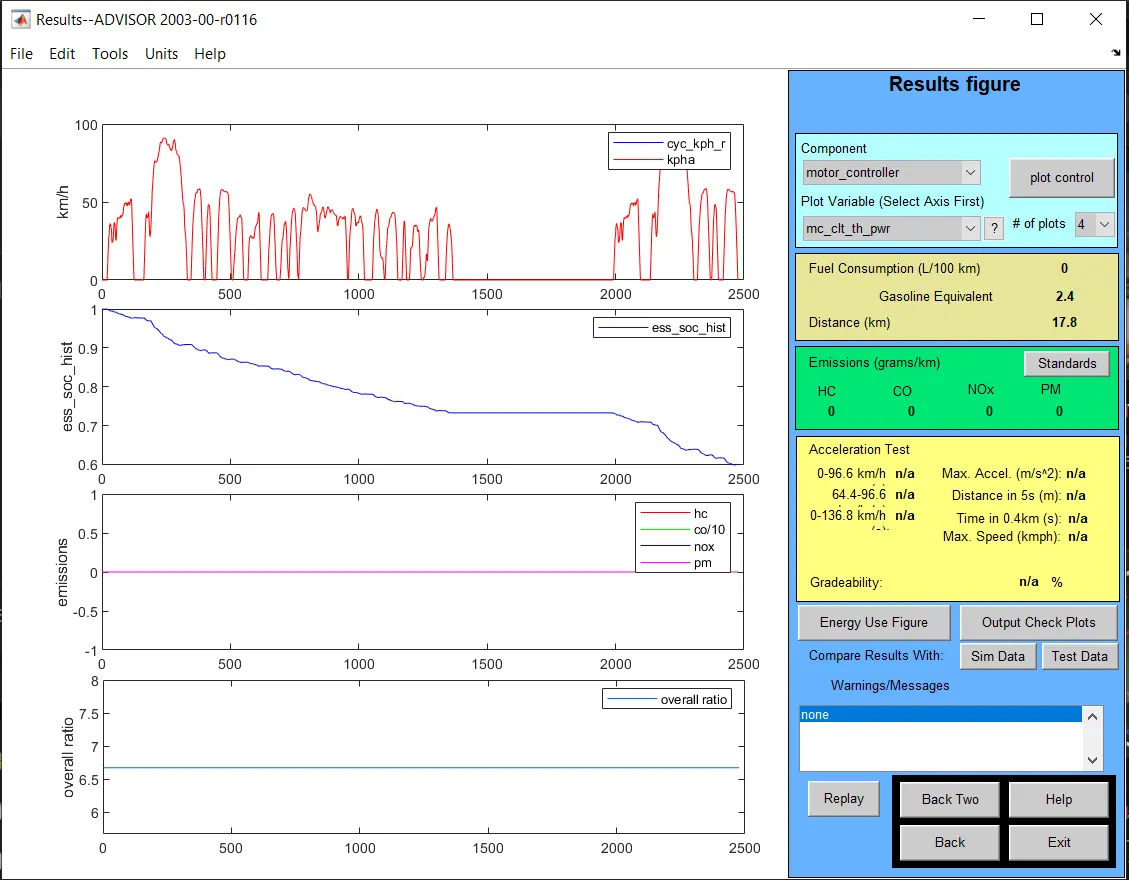
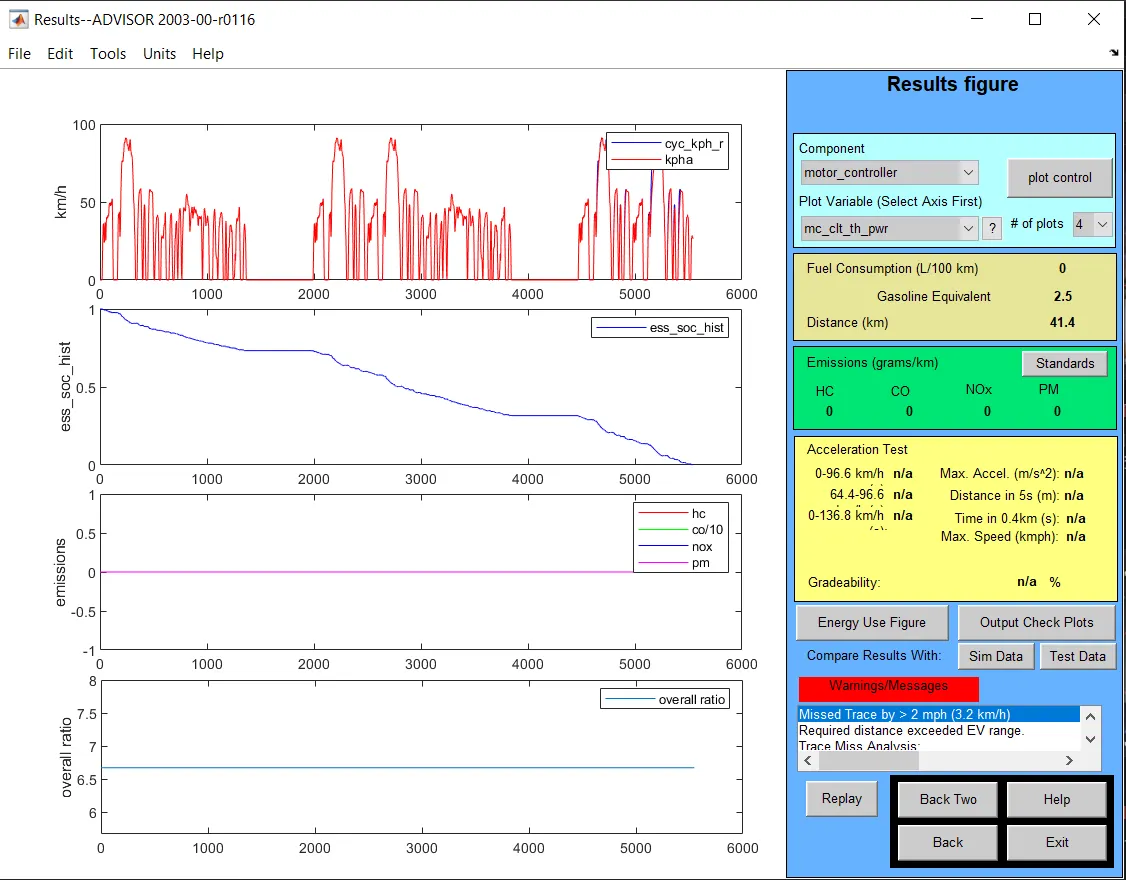
17.8km distance travelled by the vehicle in 1 drive cycle
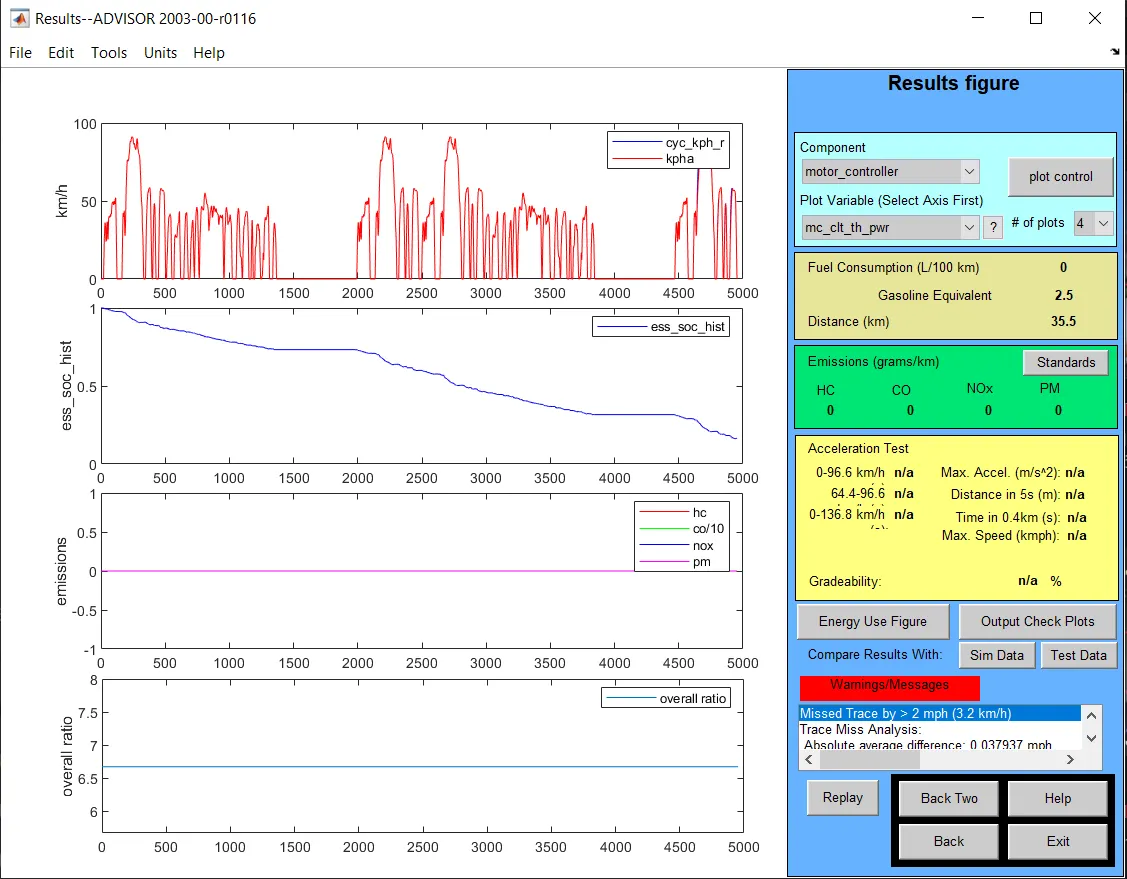
35.5km distance is travelled by the vehicle in 2 drive cycles.
41.1 km distance is travelled by the vehicle in 3 drive cycles.
The minimum distance travelled by the car is 17.8 km with drive cycle CYC_FTP where as the maximum distance travelled by the car is 41.1 km consuming 100 % of the battery charge in 3 drive cycle.
Thus EV_default cannot travel a distance of 45 km in any drive cycle.
Solution 2: - In the above case, we can try changing the battery capacity and repeat the simulation.
In the input window, we will change the capacity of the battery from energy storage which will be open in first
‘#of mod V nom’ describes the battery capacity, so we change the module number of batteries.
By changing the module number we see the weight of battery also change. We now run the simulation.
A new window will popup and we change the drive cycle to 2 or 3 cycles and run the simulation.
After the competition of simulation result window will popup and the changes are observed.
We repeat the simulation by changing the battery module and observe the result.
|
Battery Mod |
Voltage |
KM |
Battery Weight |
|
Drive cycle 2 |
|||
|
26 |
321 |
35.5 |
286 |
|
27 |
333 |
35.5 |
297 |
|
28 |
345 |
35.5 |
308 |
|
Drive cycle 3 |
|||
|
26 |
321 |
42.7 |
286 |
|
27 |
333 |
44.8 |
297 |
|
28 |
345 |
46.3 |
308 |
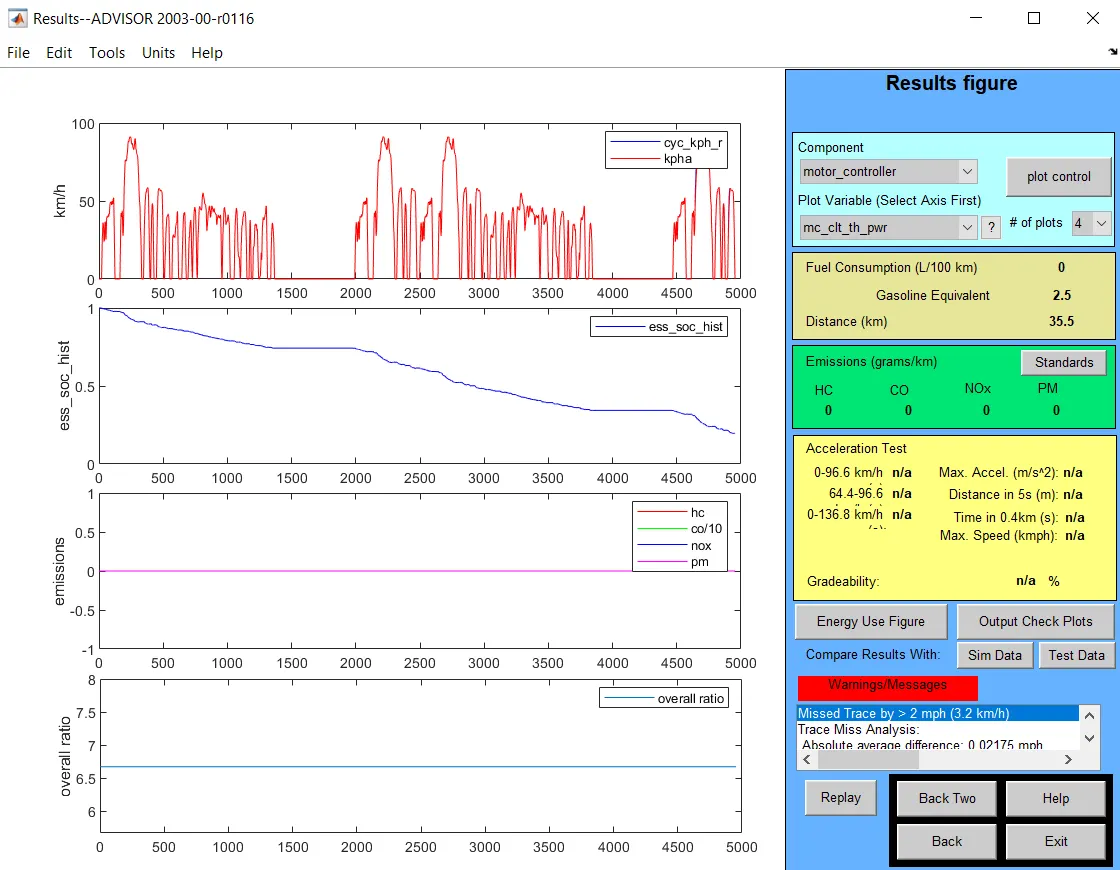
Changing the battery module in drive cycle 2 we get a constant distance travelled. Changing battery module in drive cycle 3 we get changes in distance travelled by the vehicle.
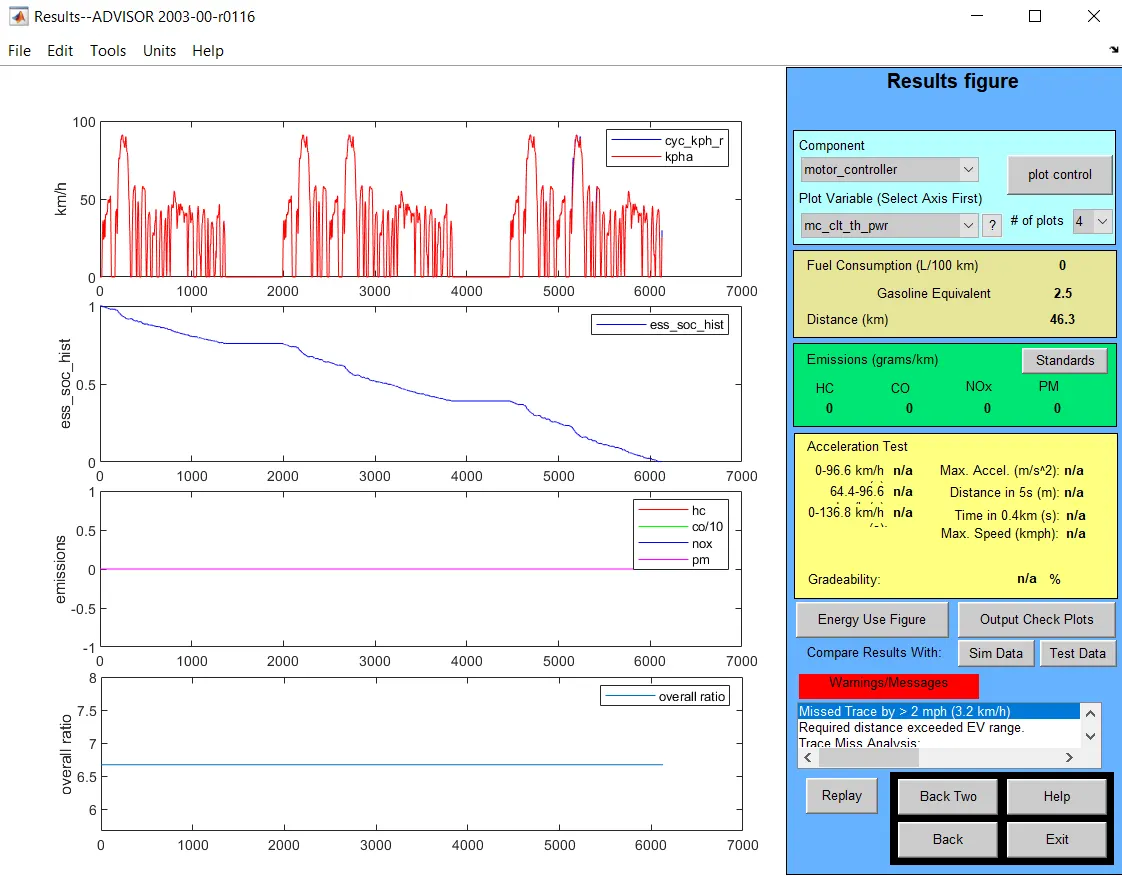
A 28 module 345-volt battery will help the vehicle cover 45 km.
Battery capacity with module 26 with 2 drive cycle
Battery module 28 with 3 drive cycle
Solution 3: - Perform gradeability test with PRIUS_Jpn_default_in file. Compare your results in the table and conclude.
In ADVISOR tool vehicle input window select PRIUS_jpn_default model.
Continue to the next window
Simulation parameter window will popup
Select gradeability test and click grade options, a new dialogue box will open.
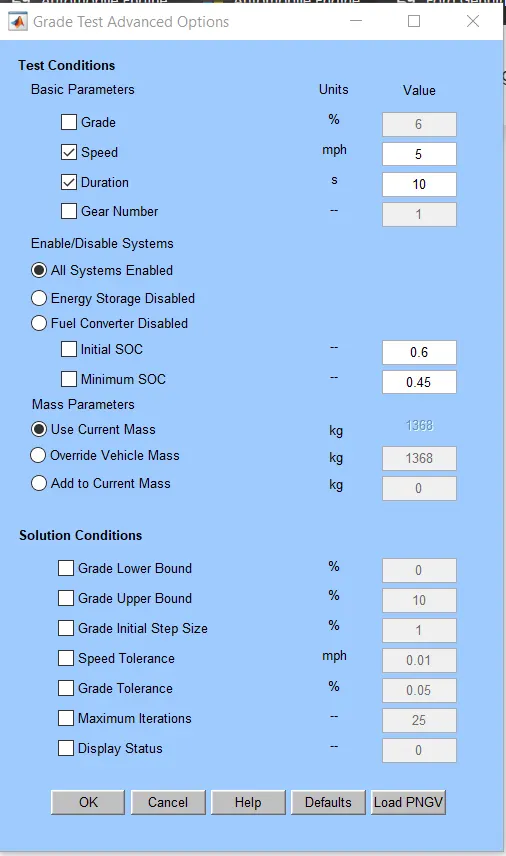
In grade option box we can change speed or duration with respect to our simulation.
Thus, for this simulation, we change speed one time and duration another time.
Click on all system enabled also click on constant road grade.
Click OK and run the simulation and the result window will popup showing different result based on the input data.
Duration-10s
|
Vehicle speed mph |
Vehicle speed kmph |
Gradeability% |
|
5 |
8 |
32.8% |
|
10 |
16.1 |
30.3% |
|
15 |
24.1 |
24.4% |
|
20 |
32.2 |
19.8% |
|
25 |
40.2 |
16.5% |
|
30 |
48.3 |
14.7% |
|
35 |
56.3 |
13.0% |
|
40 |
64.4 |
11.7% |
|
45 |
72.4 |
10.7% |
|
50 |
80.5 |
9.7% |
Duration-20s
|
5 |
8 |
35.2% |
|
10 |
16.1 |
33.7% |
|
15 |
24.1 |
27.7% |
|
20 |
32.2 |
22.9% |
|
25 |
40.2 |
19.7% |
|
30 |
48.3 |
17.7% |
|
35 |
56.3 |
16% |
|
40 |
64.4 |
14.6% |
|
45 |
72.4 |
13.4% |
|
50 |
80.5 |
12.4% |
We can conclude that with increase n the vehicle speed there is a decrease in gradeability in both conditions related to the duration