Week 2 Air standard Cycle
"""
air standard cycle
"""
import math
import matplotlib.pyplot as plt
# inputs
p1= 101325
t1= 500
t3=2000
#geometric parameters
bore =0.1
stroke=0.1
con_rod=0.15
cr=12
gamma=1.4
#volume computation
v_s=(math.pi/4)*pow(bore,2)*stroke
v_c=v_s/(cr-1)
v1=v_c-v_s
# state point 2
v2=v_c
#p2v2^gamma = p1vi^gamma
p2= p1*pow(v1,gamma)/pow(v2,gamma)
#p2v2/t2=p1v1/t1 |rhs=pv1/t1 | p2v2/t2 =rhs | t2=p2v2/rhs
rhs=p1* v1/t1
t2=p2*v2/rhs
#state point 3
v3=v2
#p3v3/t3=p2v2/t2 | rhs = p2v2/t2| p3=rhs*t3/v3
rhs= p2*v2/t2
p3=rhs*t3/v3
#state point 4
v4=v1
#p4v4^gamma =p3v3^gamma
p4=p3*pow(v3,gamma)/pow(v4,gamma)
#p4v4/t4=p3v3/t3=rhs
t4=p4*v4/rhs
# Thermal efficiency
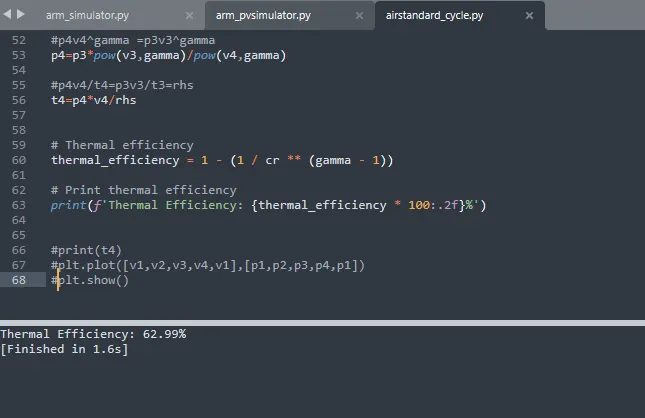
thermal_efficiency = 1 - (1 / cr ** (gamma - 1))
# Print thermal efficiency
#print(f'Thermal Efficiency: {thermal_efficiency * 100:.2f}%')
#print(t4)
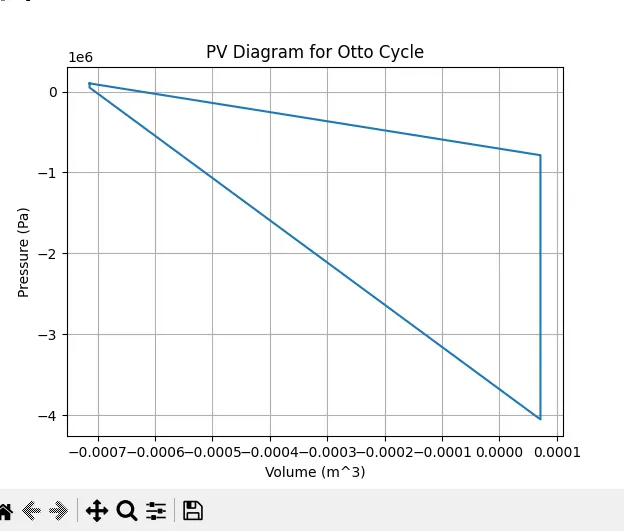
plt.plot([v1,v2,v3,v4,v1],[p1,p2,p3,p4,p1])
plt.xlabel('Volume (m^3)')
plt.ylabel('Pressure (Pa)')
plt.title('PV Diagram for Otto Cycle')
plt.grid(True)
plt.show()