Week 2 Air standard Cycle
Objective - To plot otto cycle in a PV diagram and find out thermal efficiency
Problem Statement- Write a code in python to generate a plot of otto cycle in a PV diagram. The program should output the thermal efficiency.
Solution
import math
import matplotlib.pyplot as plt


def engine_kinematics ( bore, stroke, conrod, cr, start_crank, end_crank):

    a = stroke / 2
    R = conrod / a

    # volume parameters
    V_s = math.pi * (1 / 4) * pow(bore, 2) * stroke
    V_c = V_s / (cr - 1)

    sc= math.radians(start_crank)
    ec = math.radians(end_crank)

    num_values = 50

    dtheta = (ec-sc) / (num_values-1)

    V = []

    for i in range(0,num_values):
        theta = sc + i * dtheta
        term1 = 0.5 * (cr - 1)
        term2 = R + 1 - math.cos(theta)
        term3 = pow(R, 2) - pow(math.sin(theta), 2)
        term3 = pow(term3, 0.5)
        V.append ((1 + term1 * (term2 - term3)) * V_c)

    return V

#------------------------------------------------------------------------------------
#inputs
p1= 10125
t1= 500
gamma = 1.4
t3= 2300

#geo inputs
bore = 0.1
stroke = 0.1
conrod = 0.15
cr = 4

#thermal efficieny
g= gamma - 1
efficiency = 1- ( 1 / pow(cr,g))
efficiency = efficiency* 100
print('thermal efficiency=',efficiency , '%')


# volume computation
v_s = (math.pi /4 )* pow( bore, 2) * stroke
v_c = v_s /(cr -1)
v1 = v_c + v_s

# state point 2
v2 = v_c

# p2v2^ gamma   = p1v1 ^ gamma

p2 = p1 * pow (v1, gamma)/ pow (v2 , gamma)

#p2v2 / t2 = p1v1/ t1

rhs = p1*v1 /t1
t2 = p2 * v2 / rhs
V_compression= engine_kinematics(bore,stroke,conrod,cr,180,0)
constant = p1 * pow(v1, gamma)

P_compression = []

for v in V_compression:
    P_compression.append(constant/ pow(v,gamma))

#state point 3
v3= v2

# p3v3/t3 = p2v2/t2

rhs = p2 * v2 /t2

p3= rhs * t3/ v3


V_expansion= engine_kinematics(bore,stroke,conrod,cr,0,180)
constant = p3 * pow(v3, gamma)

P_expansion= []

for v in V_expansion:
    P_expansion.append(constant/ pow(v,gamma))

# state 4

v4= v1

#p4v4 ^ gamma = p3v3 ^ gamma

p4 = p3 * pow(v3, gamma) / pow(v4, gamma)

#p4v4/t4 = rhs

t4= p4 * v4 / rhs

plt.plot( [v2,v3],[p2,p3])
plt.plot(V_compression,P_compression)
plt.plot(V_expansion,P_expansion)
plt.plot( [v4,v1],[p4,p1])
plt.show()
Procedure
Taken the variables for geometrical inputs and other constants.
Step by step calculated the state points pressure temperature and volume values.
using a function created all the possible values of pressure with respect to volume.
calculated the thermal efficiency using the formula
Results and Discussion
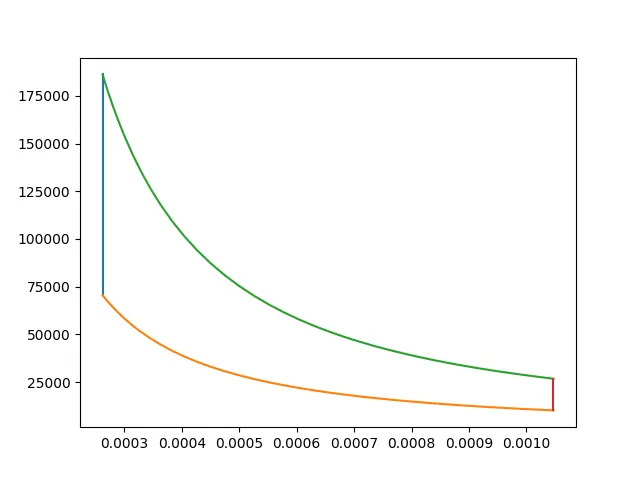
OUTPUT:
/Users/surajit/PycharmProjects/pythonProject13/venv/bin/python /Users/surajit/PycharmProjects/pythonProject13/otto.py
thermal efficiency= 42.565082250148244 %
Process finished with exit code 0