Week 2 Air standard Cycle
AIM:
learnt during the forward kinematics routine, go ahead and write code that can solve an otto cycle and make plots for it
PROCEDURE:
1.importing the math and matplot and numpy
2.input values are
specific heat ratio, gamma =1.4
pressure in state 1 ,p1 = 101325
temperature in state 1 ,t1 = 500
temperature in state 3 ,t1 = 2300
dia. of cranck shaft , bore = 0.1
stroke length , stroke = 0.1
connectiong rod length , con_rod = 0.15
compression ration , cr = 12
3. defining the function of volue is
def engine_kinematics(bore,stroke,con_rod,cr,start_crank,end_crank)
in a engiines crank angle can vary in the crank strokes
paramerts in engine kinematic
crank pin radius, a = stroke/2
R = con_rod/a
swept volume, V_s = math.pi*(1/4)*pow(bore,2)*stroke
clearence volume, V_c = V_s / (cr-1)
4. taking the starting and ending crank angele
taking 50 values in bwtween the start crank and end crank
num_values =50
5.equation of caluclation the volume is a big formula , that can be spilt into several terms
term1 = 0.5*(cr-1)
term2 = R + 1 - math.cos(theta)
term3 = pow(R,2) - pow(math.sin(theta),2)
total volume is sume of term multiplied by clearance volume
V.append((1 + term1*(term2 - term3))*V_c)
6. state at point 1
swept volume , v_s = (math.pi/4)*pow(bore,2)*stroke
clearence volume , v_c = v_s/(cr-1)
volume at 1 , v1 = v_c + v_s
7.state at point 2
isentropic compression in 1-2
v2 = v_c
calculating the values of p2 and t2
p2 = p1*pow(v1,gamma)/pow(v2,gamma)
t2 = p2*v2/rhs
calculating the pressure compression for volume
P_compression.append(constant/pow(v,gamma))
8.state at point 3
constant volume heat addition in 2-3
v3 = v2
calculating the values of p3
p3 = rhs*t3/v3
calculating the pressure expansion for volume
P_expansion.append(constant/pow(v,gamma))
8.state at point 4
isentropic expansion in 3-4
v4 = v1
calculating the values of p4 and t4
p4 = p3*pow(v3,gamma)/pow(v4,gamma)
t4 = p4*v4/rhs
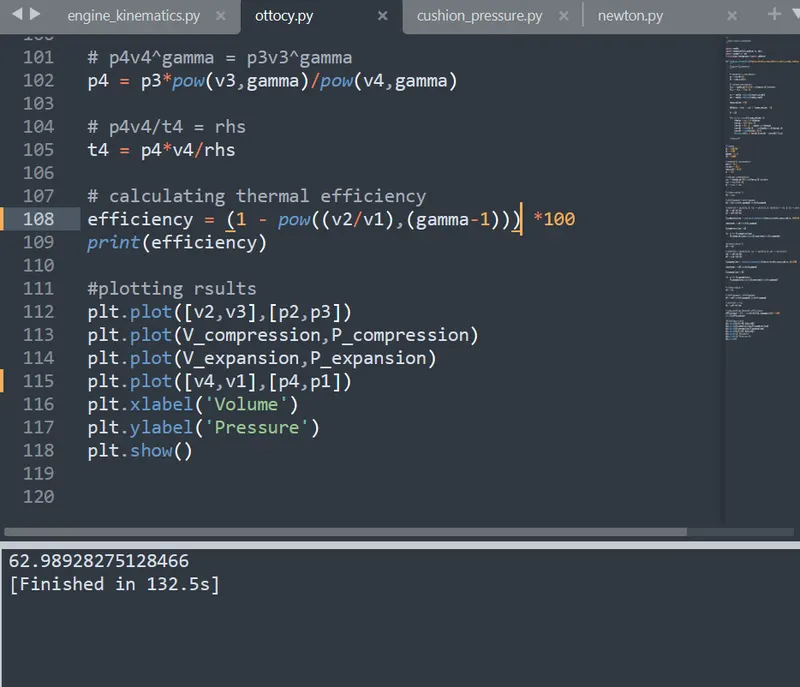
9. calculating the thermal efficiency of the engine ,by using this formula is ,
efficiency = 1 - pow((v2/v1),(gamma-1)
efficinecy is 63,
10. making the plot of volume and pressure ,
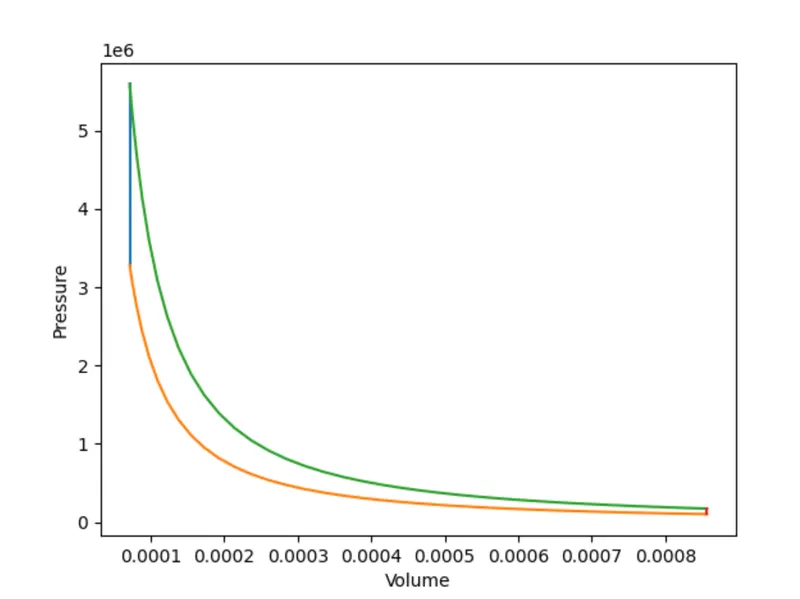
by adding 4 states in sepperaty to the plot
output plot is given below,
conclusion:
can be make coding for ploting the volume vs pressure plot
calculated the vlues of thermal efficiency
"""
  otto cycle simulator
"""

import math
import matplotlib.pyplot as plt
import numpy as np
from scipy.integrate import odeint

def engine_kinematics(bore,stroke,con_rod,cr,start_crank,end_crank):
    """
    Engine Kinematics
    """

    # geometric parameters
    a = stroke/2
    R = con_rod/a

    # volume parameters
    V_s = math.pi*(1/4)*pow(bore,2)*stroke
    V_c = V_s / (cr-1)

    sc = math.radians(start_crank)
    ec = math.radians(end_crank)

    num_values =50

    dtheta = (ec - sc) / (num_values -1)

    V = []

    for i in range(0,num_values ):
    	theta = sc + i*dtheta
    	term1 = 0.5*(cr-1)
    	term2 = R + 1 - math.cos(theta)
    	term3 = pow(R,2) - pow(math.sin(theta),2)
    	term3 = pow(term3, 0.5)
    	V.append((1 + term1*(term2 - term3))*V_c)

    return V


# inputs
p1 = 101325
t1 = 500
gamma = 1.4
t3 = 2300

# geometric parameters
bore = 0.1
stroke = 0.1
con_rod = 0.15
cr = 12

# volume computation
v_s = (math.pi/4)*pow(bore,2)*stroke
v_c = v_s/(cr-1)
v1 = v_c + v_s


# state point 2
v2 = v_c

# p2v2^gamma = p1v1^gamma
p2 = p1*pow(v1,gamma)/pow(v2,gamma)

# p2v2/t2 = p1v1/t1 | rhs = p1v1/t1 | p2v2/t2 = rhs | t2 = p2v2/rhs
rhs = p1*v1/t1
t2 = p2*v2/rhs

V_compression = engine_kinematics(bore,stroke,con_rod,cr,180,0)

constant = p1*pow(v1,gamma)

P_compression = []

for v in V_compression:
	P_compression.append(constant/pow(v,gamma))


#nstate point 3
v3 = v2

# p3v3/t3 = p3v3/t2 | rhs = p2v2/t2 | p3 = rhs*t3/v3
rhs = p2*v2/t2
p3 = rhs*t3/v3

V_expansion = engine_kinematics(bore,stroke,con_rod,cr,0,180)

constant = p3*pow(v3,gamma)

P_expansion = []

for v in V_expansion :
	P_expansion.append(constant/pow(v,gamma))


# state point 4
v4 = v1

# p4v4^gamma = p3v3^gamma
p4 = p3*pow(v3,gamma)/pow(v4,gamma)

# p4v4/t4 = rhs
t4 = p4*v4/rhs

# calculating thermal efficiency
efficiency = (1 - pow((v2/v1),(gamma-1))) *100
print(efficiency)

#plotting rsults
plt.plot([v2,v3],[p2,p3])
plt.plot(V_compression,P_compression)
plt.plot(V_expansion,P_expansion)
plt.plot([v4,v1],[p4,p1])
plt.xlabel('Volume')
plt.ylabel('Pressure')
plt.show()