Week 2 Air standard Cycle
To write a program in Python to plot an otto cycle and calculate its thermal efficiency.
Theory
An Otto cycle is an idealized thermodynamic cycle that describes the functioning of a typical spark ignition piston engine. It is the thermodynamic cycle most commonly found in automobile engines.
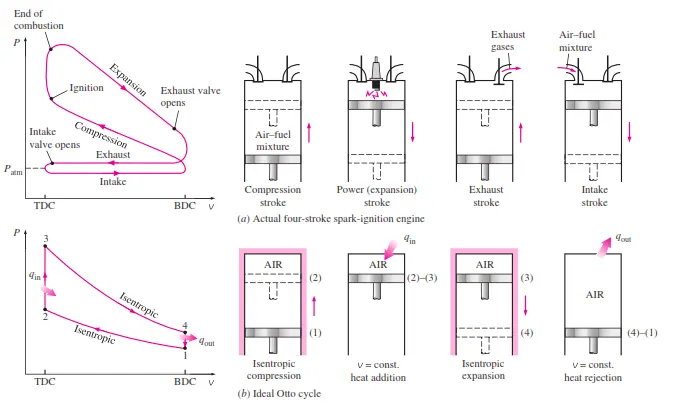
*0 is the point where the intake valve opens.
The processes are described as:
- Process 0–1 a mass of air is drawn into piston/cylinder arrangement at constant pressure.
- Process 1–2 is an adiabatic (isentropic) compression of the charge as the piston moves from bottom dead center (BDC) to top dead center (TDC).
- Process 2–3 is a constant-volume heat transfer to the working gas from an external source while the piston is at the top dead center. This process is intended to represent the ignition of the fuel-air mixture and the subsequent rapid burning.
- Process 3–4 is an adiabatic (isentropic) expansion (power stroke).
- Process 4–1 completes the cycle by a constant-volume process in which heat is rejected from the air while the piston is at the bottom dead center.
- Process 1–0 the mass of air is released to the atmosphere in a constant pressure process.
Equations Used:
- Compression ratio: Vs+Vc/Vc
Where Vs=swept volume=(pi/4)*d^2*L
- Where d=bore
- L=stroke
Vc=clearance volume
- Volume change inside the cylinder due to various processes :
- For isoentropic process, P*V^gamma=constant.
- Efficiency of otto cycle=1-(1/cr^(gamma-1))
where cr=compression ratio= 8. (Assuming)
gamma=specific heat of air=1.4
Project Objectives
- The program should create a P-V diagram
- Finding thermal efficiency for the given engine specification.
"""
Simulation of the otto cycle and the air standard efficiency for Specific Engine Parameters.
By Saurabh
"""
import math
import matplotlib.pyplot as plt

#inputs
p1=95000 # Pressure at state point 1 in pascal
t1=400 # Tempearture at state point 1 in Kelvin
gamma=1.4
t3=2500 # Temperature at state point 3 unit-Kelvin

# Engine  parameters All units in meters
bore=0.08
stroke=0.16
con_rod=0.16
c_r=8 # Compression ratio

# Volume computation

# Swept volume
v_s=(math.pi)/4*pow(bore,2)*stroke
# Clearance volume
v_c=v_s/(c_r-1)

def engine_kinematics(bore,stroke,con_rod,start_crank,end_crank):
		# Crank pin radius
		a=stroke/2
		# Crank radius
		R=con_rod/a
		# Swept volume
		v_s=(math.pi)/4*pow(bore,2)*stroke
		# Clearance volume
		v_c=v_s/(c_r-1)
		# Starting crank angle
		sc=math.radians(start_crank)
		# Ending crank angle
		ec=math.radians(end_crank)

		n_values=50

		dtheta=(ec-sc)/(n_values-1)

		v=[]

		for i in range(n_values):
			theta=(sc+i*dtheta)
			#V/V_c = 1 + 1/2(r-1)[R+1-costheta-(R^2-sin^2theta)^0.5]
			term_1=0.5*(c_r-1)
			term_2=R+1-math.cos(theta)
			term_3=pow(R,2)-pow(math.sin(theta),2)
			term_3=pow(term_3,0.5)
			v.append((1+term_1*(term_2-term_3))*v_c)
		return v

# Volume at state point 1
v1=v_s+v_c
# State point 2
#Volume
v2=v_c

# Pressure at state point 2   #p2*v2^gamma=p1*v1^gamma

p2=(p1*pow(v1,gamma))/pow(v2,gamma)

# Temperature at state point 2
#p1*v1/t1=p2*v2/t2
rhs=(p1*v1)/t1
t2=(p2*v2)/rhs
v_compression=engine_kinematics(bore,stroke,con_rod,180,0)
const=p1*pow(v1,gamma)
p_compression=[]
for V in v_compression:
	p_compression.append(const/pow(V,gamma))

# State point 3
#Volume
v3=v2

# Pressure at point 3
p3=(p2*v2*t3)/(v3*t2)

v_expansion=engine_kinematics(bore,stroke,con_rod,0,180)
const=p3*pow(v3,gamma)
p_expansion=[]
for V in v_expansion:
	p_expansion.append(const/pow(V,gamma))

# State point 4
#Volume
v4=v1

# Pressure at state point 4   # p4*v4^gamma=p3*v3^gamma

p4=(p3*pow(v3,gamma))/pow(v4,gamma)

# Temperature at state point 4
t4=(p4*v4)/rhs

#Calculating thermal efficiency of otto cycle.
eff = 1 - (t4 - t1)/(t3 - t2)
print('Efficiency of cycle =',eff)
#plotting
plt.figure()
plt.xlabel("Volume")
plt.ylabel("Pressure")
plt.title("P-V diagram for otto cycle")
plt.plot([v2,v3],[p2,p3])
plt.plot(v_compression,p_compression)
plt.plot(v_expansion,p_expansion)
plt.plot([v4,v1],[p4,p1])
plt.show()
Results-
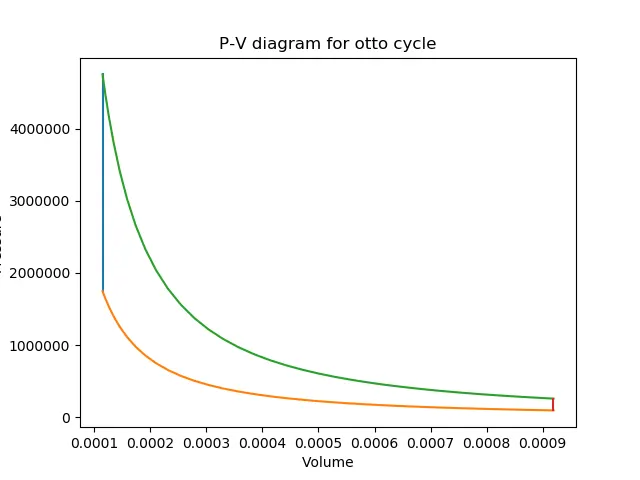
1. PV Diagram for otto cycle.
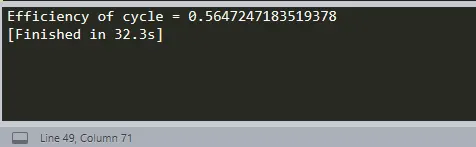
2.Air Standard efficiency of the obtained otto cycle.
Observations and Conclusions
P-V diagram of the otto cycle has been generated and the efficiency is observed to be 56.47%