Week 2- 2R Robotic Arm Challenge
Program - Foward kinematics
First Step - define the math concept and the variables:
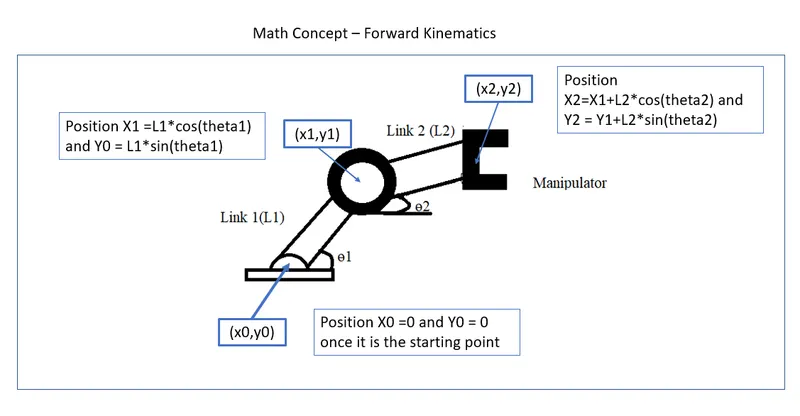
Defining the varibles:
|
L1 |
1 |
|
L2 |
2 |
|
Theta 1 |
0 to 90 |
|
Theta 2 |
0 to 90 |
The Full comented working program:
clear all %clear the workspace
close all % close all running programs and charts
clc % Clear command window

%defining the variables
l1 = 1;%define link1 lenght
l2 = 2;%define link2 lenght
theta1 = linspace(0,90,10);%define 20 angle samples between 0 and 90 corresponding to theta1
theta2 = linspace(0,90,10);%define 20 angle samples between 0 and 90 corresponding to theta2

ct=1;
for i = 1:length(theta1)%create a loop starting 1 to the lenght of theta1
    THETA1 = theta1(i);%create a new variable to store the actual value of theta1 inside the loop
    for j = 1:length(theta2)%create a loop starting 1 to the lenght of theta2
        THETA2 = theta2(j);
        x0 = 0;%defining begining point x0
        y0 = 0;%defining begining point y0

        x1 = l1*cosd(THETA1);%defining point x1 in the actual moment
        y1 = l1*sind(THETA1);%defining point y1 in the actual moment

        x2 = x1 + l2*cosd(THETA2);%defining point x2 in the actual moment
        y2 = y1 + l2*sind(THETA2);% defining point x2 in the actual moment

        %ploting
        plot([x0 x1],[y0 y1],[x1 x2],[y1 y2],'linewidth',3)%
        axis([-0.1 4 0 4])%this comand will define the axis lenght that will aappear in the chart
        pause(0.03)% define a pause between the loops to make possible to see the animated chart
        M(ct) = getframe(gcf);%get the current figure and save ar array M
        ct = ct+1;%everytime the loops ends inclement the counter
    end
end
movie(M)%generate a movie with all frames saved
videofile = VideoWriter('foward_kinematics','Uncompressed AVI')%create a videofile
open(videofile)%acess the videofile
writeVideo(videofile,M)%write the frames inside the videofile
close(videofile)%close videofile
Video generated by the program:
Mistakes done during the programing:
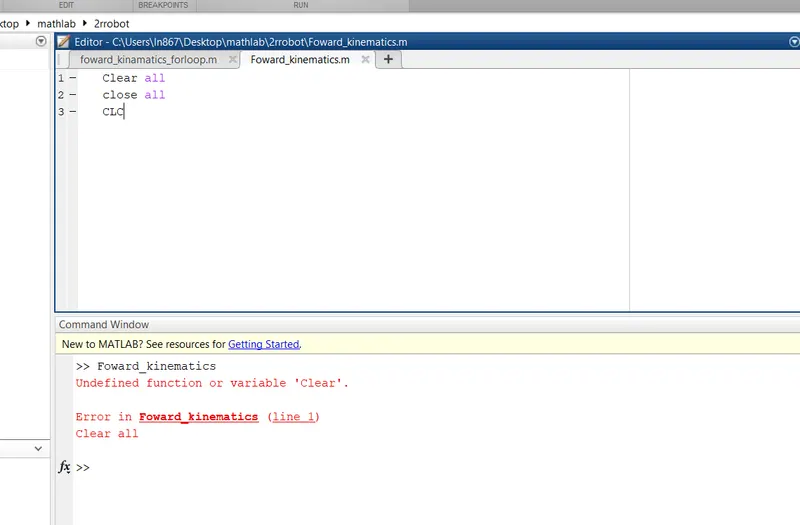
CLC and Clear all was in uppercase – I changed to lower case and it fixed the problem
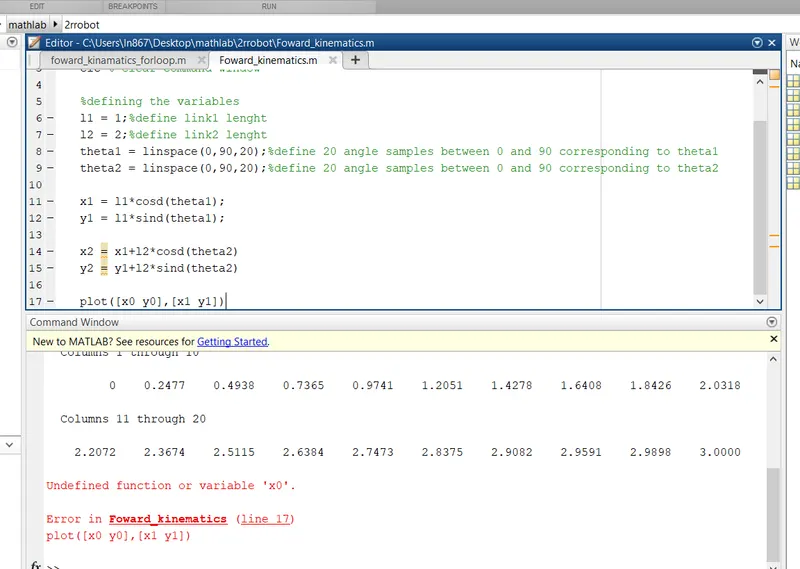
When I first tried to plot the first link the x0 and y0 variables where not defined - I defined all varibles to fix the problem
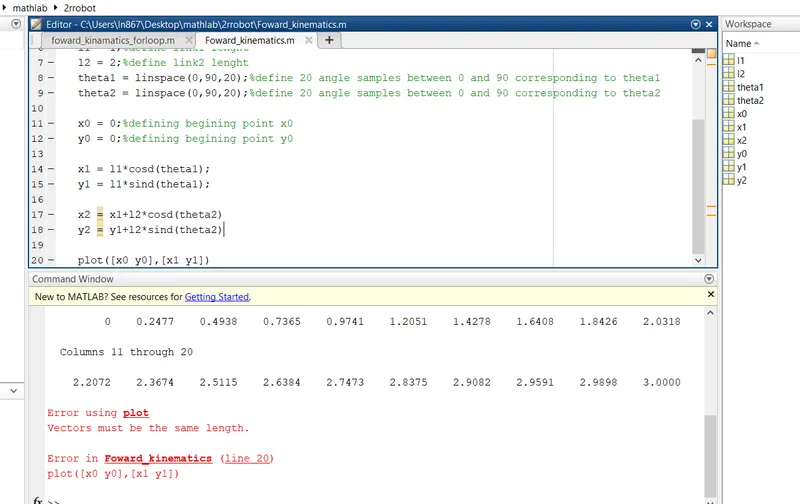
After defining the variable the Vectors did not have the same length what was corrected changing the plot command from plot([x0 y0],[x1 y1]) to plot([x0 x1],[y0 y1],[x1 x2],[y1 y2]);
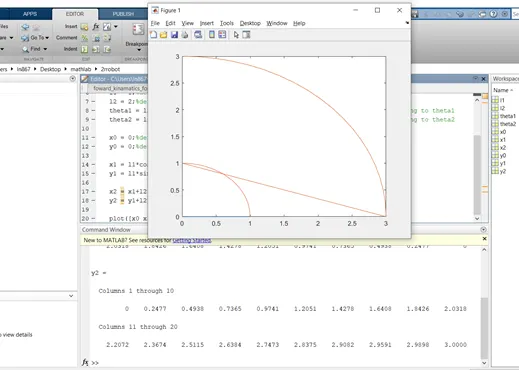
Once I was using linspace to define the theta values the graph have a strange shape
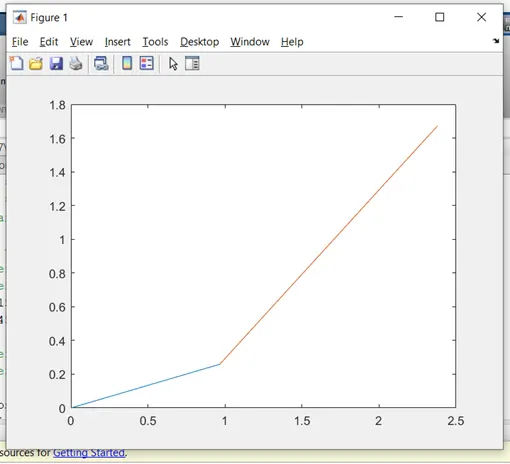
So I changed the values to a fixed value of 15 for theta1 and 45 for theta 2
Now the chart have the right shape but do not shows all positions the arm can reach
After including the for loop a error appeared once the command length was written wrong.
After correcting all mistakes including the second for variable I changed to j
The chart appears to be incorrect only showing the second arm,
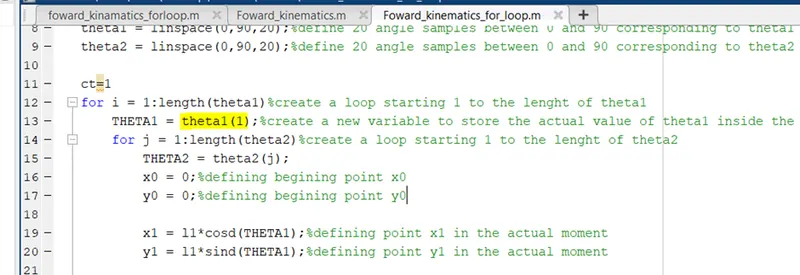
The reference value inside the first loop for THETA1 was 1 and must be i
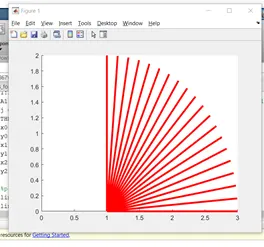
After that the command movie what written with capital letter
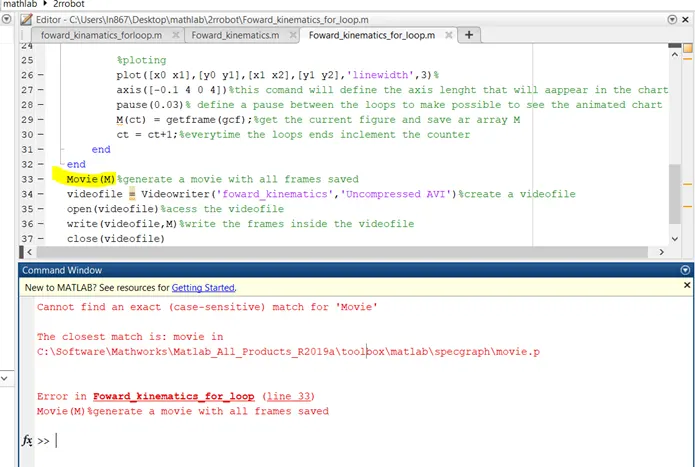
After all this changes and a final review the program was finished and run as expected