Week -2
Problem 1: Make a Simulink model of Doorbell using solenoid block.
A doorbell is defined as a device comprised of mechanical as well as electrical components. It generates melodious sound when the switch is turned on by some user.
Pressing the switch completes the circuit which leads to generation of magnetic force which causes a force which acts on the plunger. As a result, the plunger strikes the gong and sound is generated.
Solenoid is an electromagnetic device which produces magnetic force around the soft iron core which is wound with the current carrying wire, due to which the core is forced to move. So, the solenoid can be defined as a device which is capable of converting the electrical energy (or electrical signal) into mechanical energy (motion).
The Simulink model block diagram of the doorbell generated is shown below:
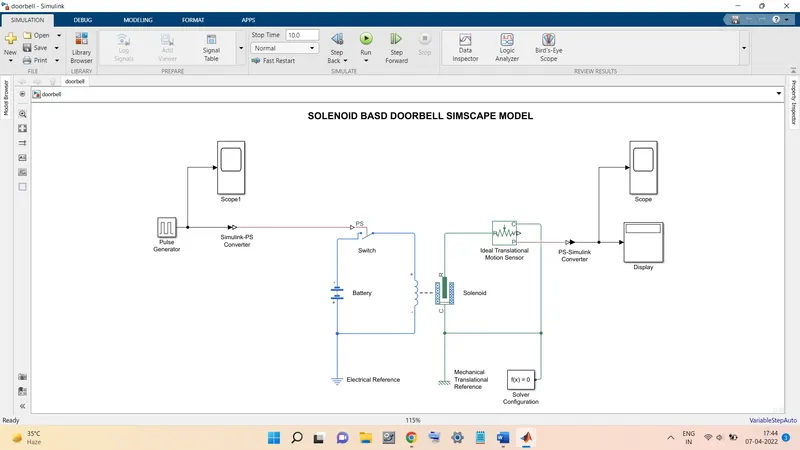
Different components of the block diagram are as follows:
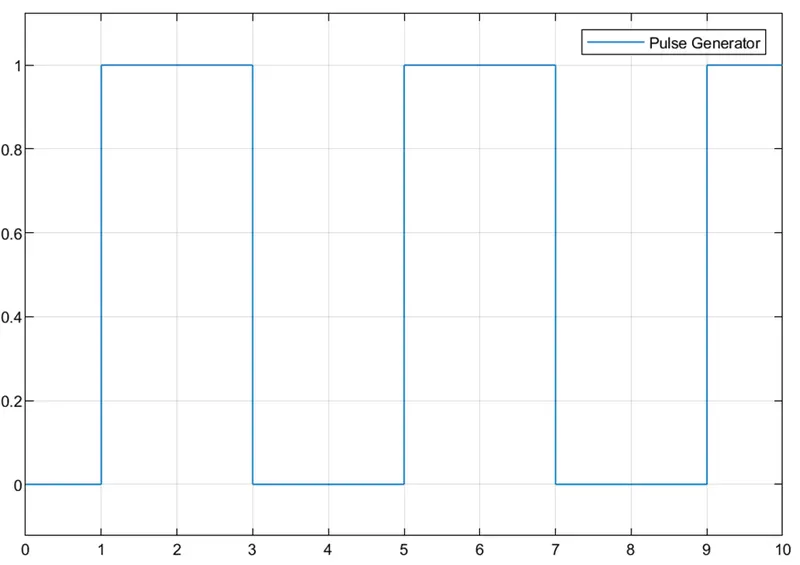
- Pulse Generator: this block supplies the input signal to the doorbell system. The signal sent is a square wave pulses at periodic intervals. The amplitude, wavelength and delay period, all these parameters of the wave can also be altered based on the user’s choice. For the present example, the amplitude is kept as 1 unit, time period is set to 4 seconds, the pulse width is 50% of the time period and the phase delay is equal to 1 second. The input values are shown in the figure shown below.
- Simulink-PS Convertor: This block is used to convert the Simulink signal type into a physical signal type that the Simscape understands.
- Switch: this block represents a real-life switch that breaks or connects the circuit on user’s choice.
- Battery: this block supplies the electrical energy to the doorbell system.
- Electrical Reference: this block is a reference block shown the system is having the ground acting as base.
- Solenoid: this block represents a solenoid, when current passes through it the iron core will move in or out.
- Ideal Translational Motion Sensor: this model is designed to sense the translational signals coming from the input media. This model then converts the translational signal into appropriate position or velocity signals. Ideal name signifies that there are no internal losses accounted into the system like friction, inertia, etc.
- Mechanical Translational Reference: this block acts as a fixed point or a reference point or a frame of reference for measuring the mechanical translational motions.
- Solver Configuration: this block specifies all the required parameters that must be solved for a given model in order to successfully execute the model and obtain the outputs from it.
- PS-Simulink Converter: this block converts the physical model signals into the Simulink signals.
The input pulse signal characteristics are already shown in figure mentioned above and the input pulse as seen through the scope1 is shown below:
The input signal passes through the Simulink-PS converter and gets changed into a physical signal form (electrical pulse signal for this case) and goes into the electrical circuit as shown in blue colour.
This circuit consists of a battery source, a switch, one solenoid block and the electrical reference element as shown in the block diagram.
Once the circuit is complete the electrical pulse flows in the solenoid and generates the magnetic force which will force the iron core to move.
The green colour block in middle represents the iron core.
This core is connected to the ideal mechanical motion sensor that will sense motion of the core.
The green circuit is the mechanical circuit which consists of the ideal mechanical translational sensor, mechanical reference block, mechanical part of the solenoid and the solver configuration block.
The P-port of translational sensor is the out port of the motion signal of the iron core of the solenoid. This port is connected with the PS-Simulink converter which converts the physical signal (translational signal) into Simulink signals.
The solver configuration block is attached with the mechanical circuit.
In the solenoid block, the values for different mechanical parameters are shown in the figure below:
Here the value of the damping factor is set to 1 N/(m/sec). on changing the value of the damping there are changes observed in the motion of the plunger.
For the current value of damping the output obtained and seen through the 'scope' is shown below:
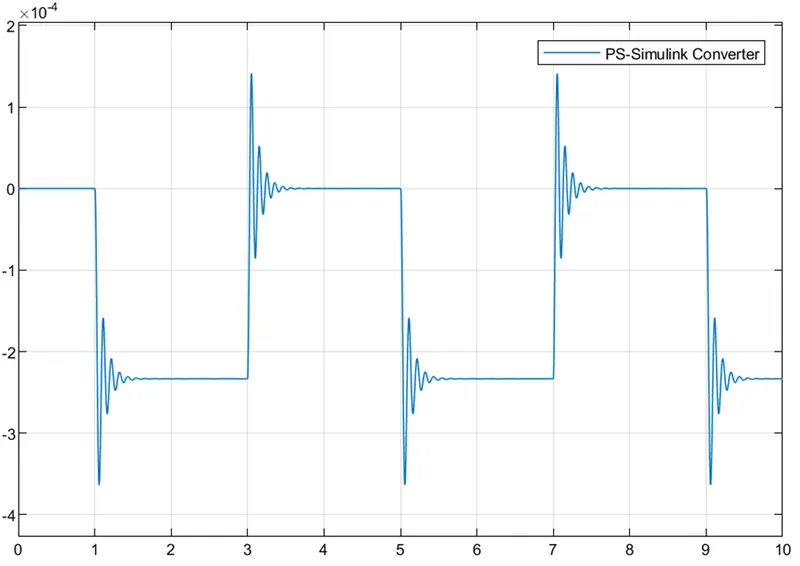
The above plot shown the position of the plunger of the bell during the bell switch is on. The graph shows the vibration motion of the plunger that dies out as shown in the figure. The amplitude of the vibrations is seen reduce for the higher values of damping. The following figures shows the outputs when damping values are set to 2, 4 and 8 N/(m/sec) respectively.
For 2 N/(m/sec):
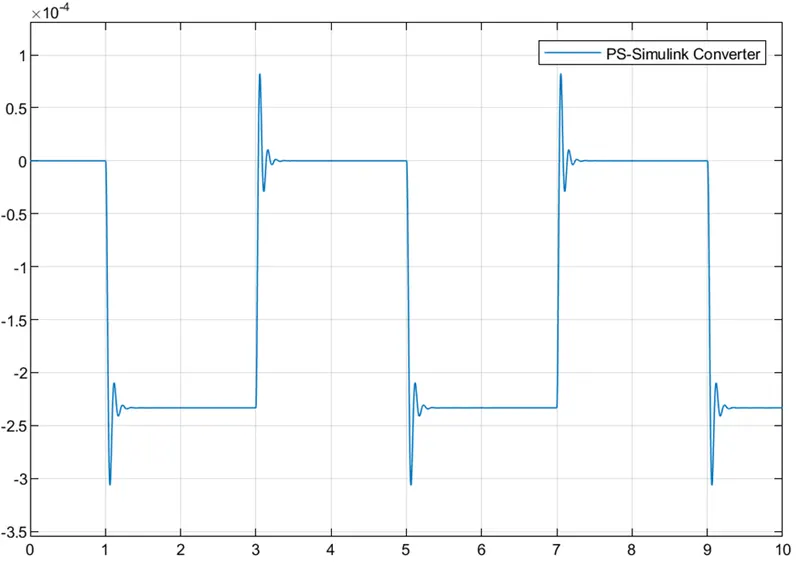
The number of vibrations are reduced and the amplitude of the vibration is also decreased.
For 4 N/(m/sec):
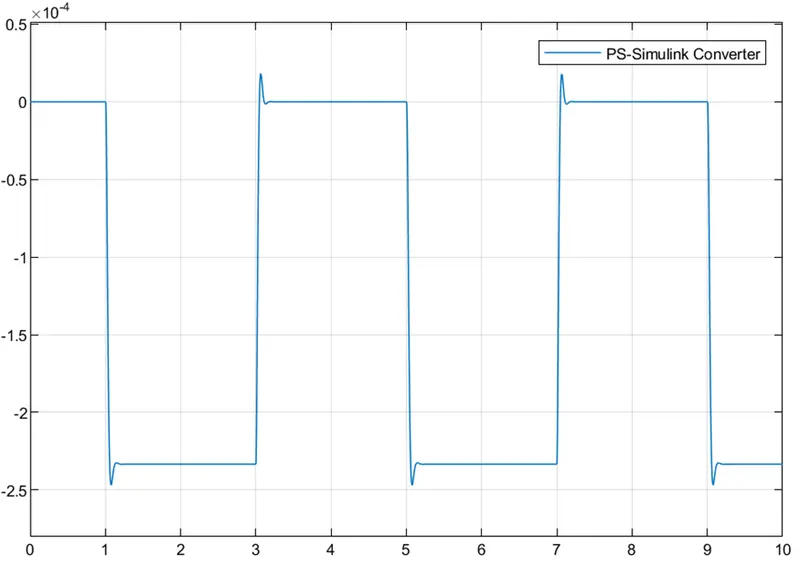
The vibrations are reduced to just a single spike for each pulse cycle. Also the amplitude is further reduced.
For 8 N/(m/sec):
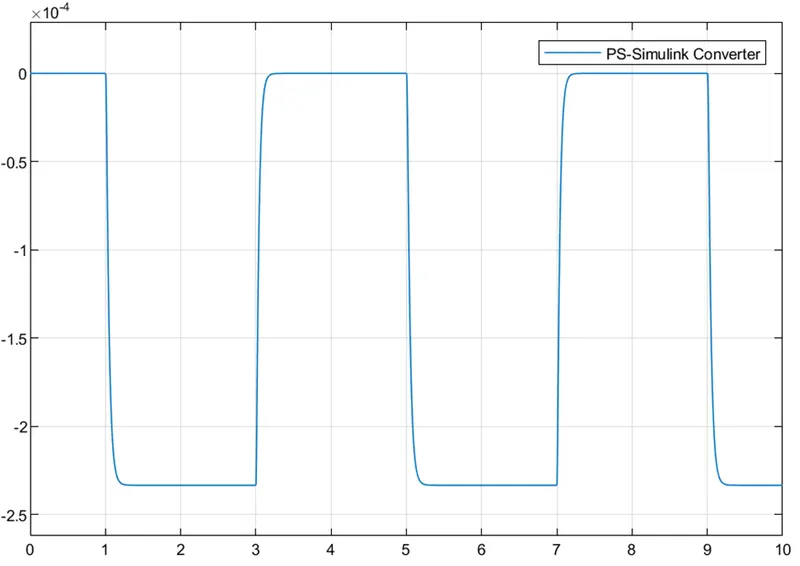
The vibrations are completely eliminated for this value of damping.
Problem 2: Use a thermistor to sense the temperature of a heater and turn on or turn off the fan as per the conditions mentioned.
A thermistor can be defined as a special kind of resistor in which it is observed that with change in the temperature of the resistor its resistance also varies. The thermistors are used to for measuring the temperature of a circuit.
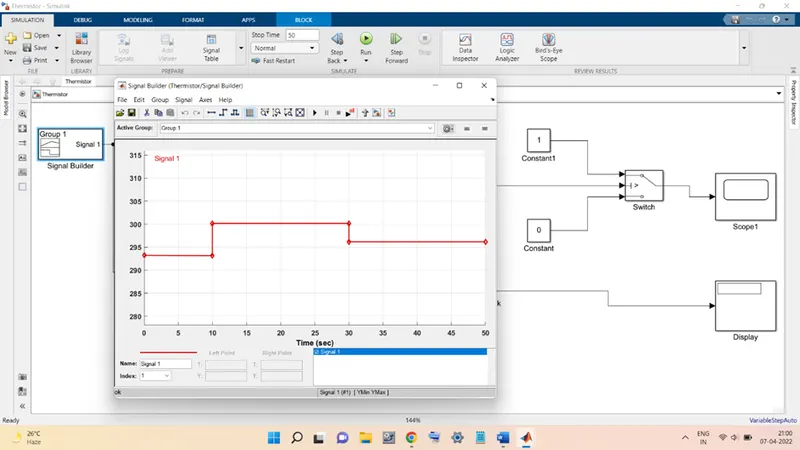
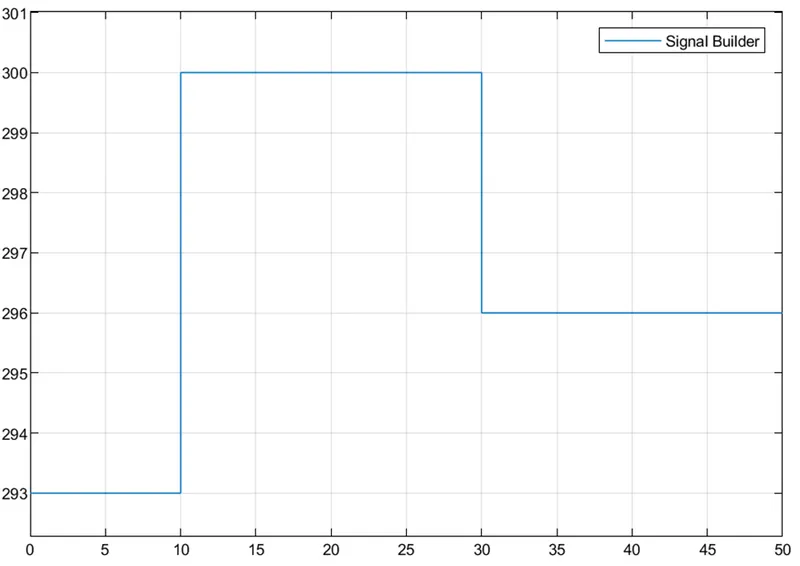
In the given problem, the temperature is 293K for 0-10 secs.
for 10-30 secs, temperature is 300K.
for 30-50 secs, the temperature is 296K.
the fan is desired to be in turned on state when the temperature of the circuit is equal to or above 298K.
the complete block diagram for the given problem is shown below:
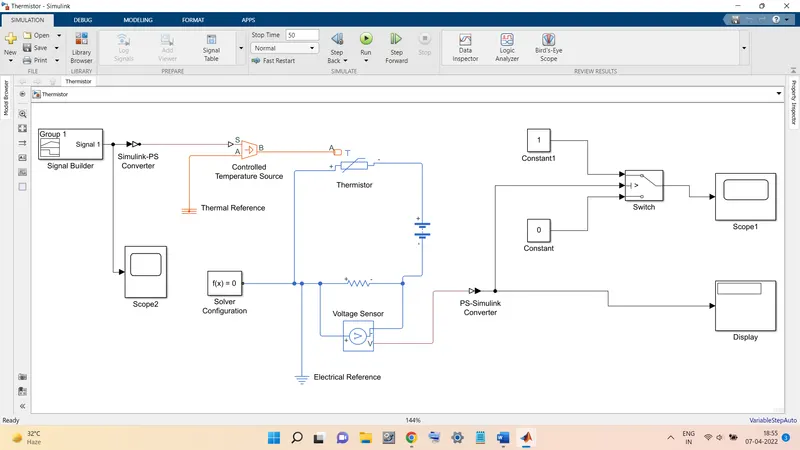
The components of the block diagram are:
- Signal Builder: this block is capable of creating input signal waves of various profiles such as constant, step, pulse, square, sawtooth, sine, etc. For the given problem, this block is used to create input signal such that for 0-10 secs the signal is constant at value 293K. for 10-30 secs the input is constant value at 300K and for 30-50 secs the signal is a constant value of 296K. The signal diagram is shown
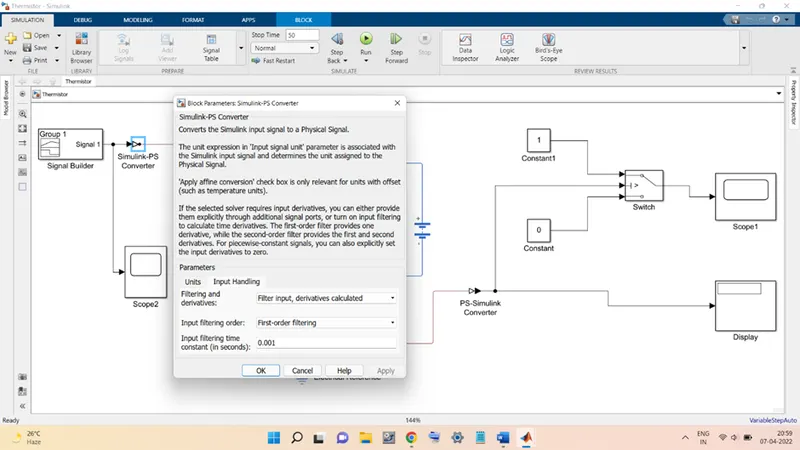
- Simulink-PS Converter: this will convert the signal from the signal builder into the physical signal (electrical signal for this case). It is necessary to change the parameter settings to Filter input, derivatives calculated under the option of filtering and derivatives.
- Controlled Temperature Source: This block represents an ideal energy source in a thermal network that can maintain a controlled temperature difference.
- Thermistor: this block represents the thermistor. It is connected to the constant temperature source so that a constant temperature supplied to it continuously. As a result, the resistance of the thermistor is maintained constant.
- Battery: this block represents the battery source supplying the electrical energy into the circuit shown in blue.
- Resistor: this is a block representing a resistance present in the given circuit.
- Voltage Sensor: this block is a sensor and its purpose here is to sense the voltage difference across the resistor block.
- Electrical Reference: this block is a reference block shown the system is having the ground acting as base.
- Solver Configuration: this block specifies all the required parameters that must be solved for a given model in order to successfully execute the model and obtain the outputs from it.
- PS-Simulink Converter: this block converts the physical model signals into the Simulink signals.
- Switch: this block is like a switch that will turn on whenever the input to this switch element is equal or greater than certain threshold value. The input to this switch is the voltage signal measured by the voltage sensor. The voltage across the resistor is 0.01099 when the temperature is 298K. so, the threshold value for the switch is kept this value to turn the switch on.
- Scopes: these are the elements that plots the input signals against the total time of the simulation (50 secs for this problem). Here scope2 is plotting the signal from the signal builder and scope1 is plotting the signal from switch block which will be either equal to 1 if threshold is reached or 0 if not.
- Display: this block displays the output result of the voltage sensor.
The input signal from the signal builder block is shown below:
The output plot from the switch block as obtained in scope1 is shown below:
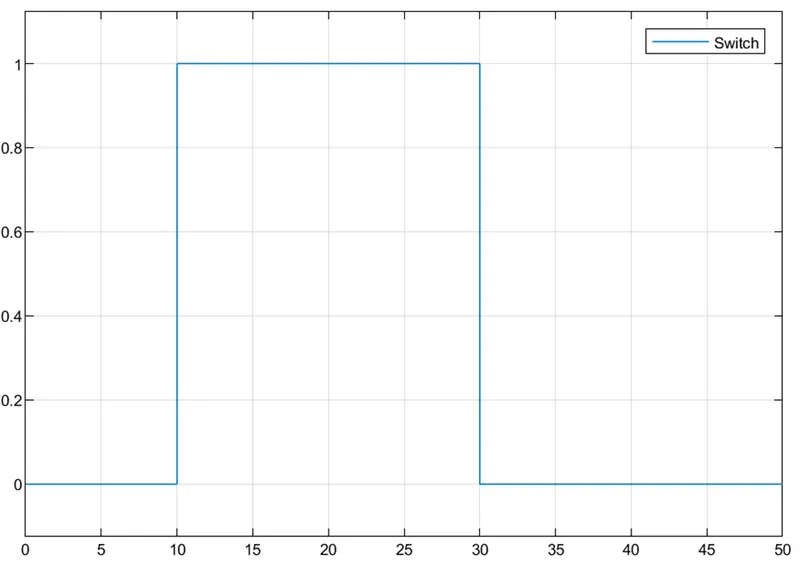
This graph shows that the fan switch will be turned on for the time interval from 10-30 secs.
all the screenshots and pictures are attached below.