Week 12.1: 2D Cavitation simulation
Cavitation Simulation
Objective:
1.To Set up and run 3 cases for Winkl Hoffer Nozzle to study Cavitation,
- Case 1: Set up the case for Pressure difference of 30 bars
- Case 2: Set up the case for Pressure difference of 70 bars
- Case 3: Set up the case for Pressure difference of 100 bars
2.Post process results in Paraview:
- Plot contours for Velocity
- Plot contour for void fraction
- Plot contour for mass flow rate
- plot contour for mass fraction
Geometry:
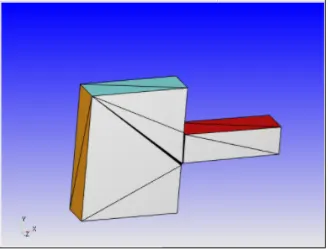
The Winkyl-Hoffer geometry was imported into Converge.
Grid control:
Element size:dx = 4e-5m, dy = 4e-5m & dz = 4e-5m
Setup:
- Application: General Flow
- Solver: Transient solver
- Simulation Type: Multiphase simulation
- Material:
Liquid tetradecane(IC14H30)
Gas tetradecane(C14H30)
Initially, in the domain, there will be only liquid tetradecane & when the cavitation occurs the liquid tetradecane(IC14H30) will be converted into gas tetradecane(C14H30). - Simulation mode: Full hydrodynamic
- Simulation time parameters:
Start time:0 sec
End time:0.0002 sec - Region & Initialization:
Created a region for initializing the setup - Boundary conditions
Inlet - Inflow - Pressure - 100 bar
Pressure difference - 30 bar, 70 bar and 100 bar.
Outlet - Outflow - Static Pressure - 300 bar
Top and bottom wall - Wall - Law of wall
Side wall A and B- 2d
Throat - Wall - Law of wall - Turbulence Model - K epsilon and VOF model
- AMR and Fixed embedding
- The time interval for writing 3D output data files: 5e-5 sec
- The time interval for writing text output:1e-10 sec
- The time interval for writing restarting output:1e-5sec
- Maximum number of restart file saved:5
Results:
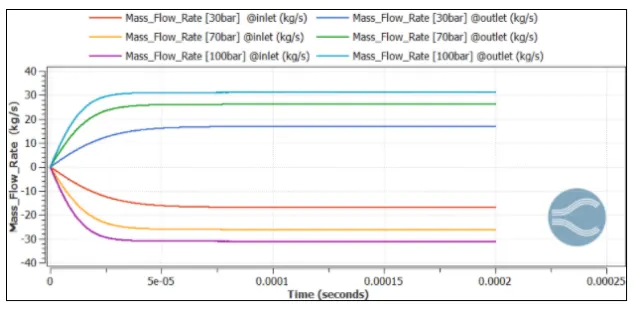
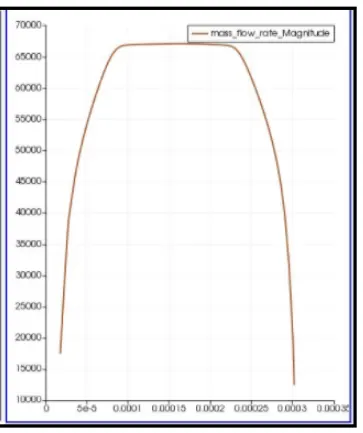
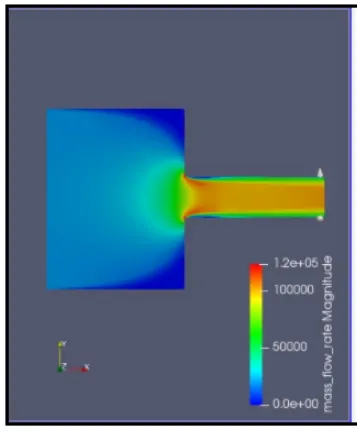
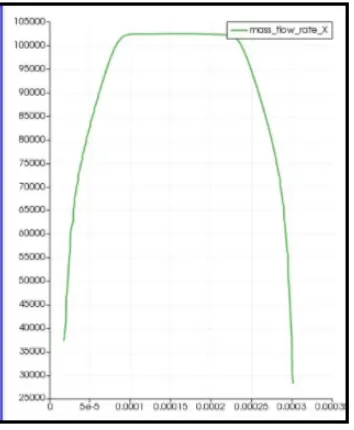
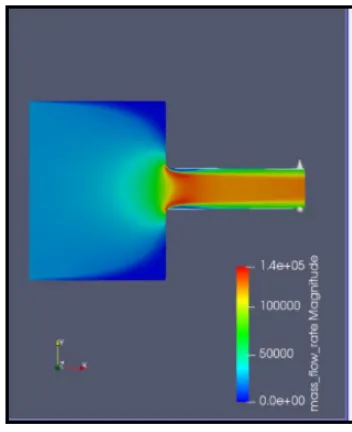
Mass flow rate:
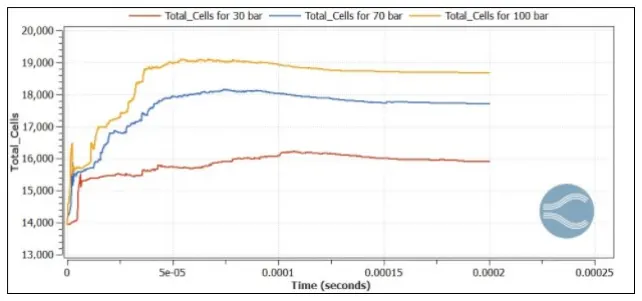
Total cell count:
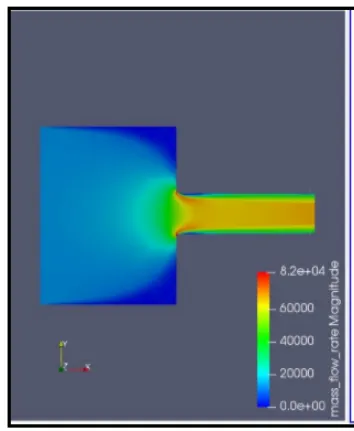
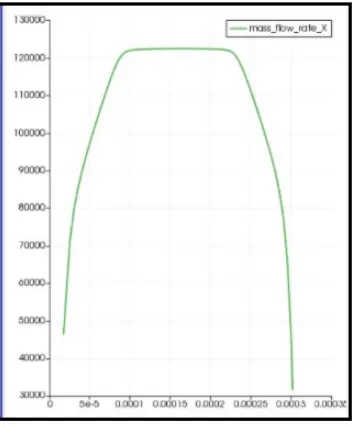
Mass flow rate Contour and Plots :
1.Pressure difference 30 bar:
2.Pressure difference 70 bar:
3.Pressure difference 100 bar:
Velocity contours:
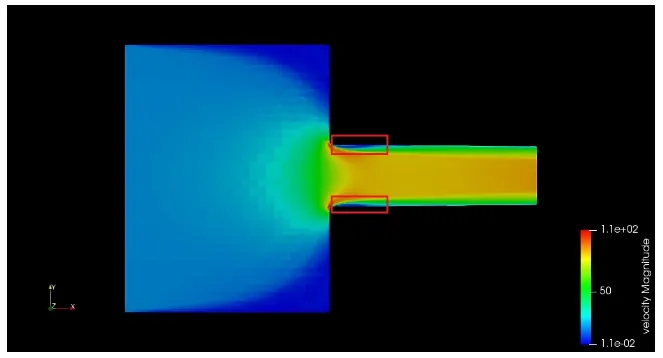
1.Pressure difference 30 bar:
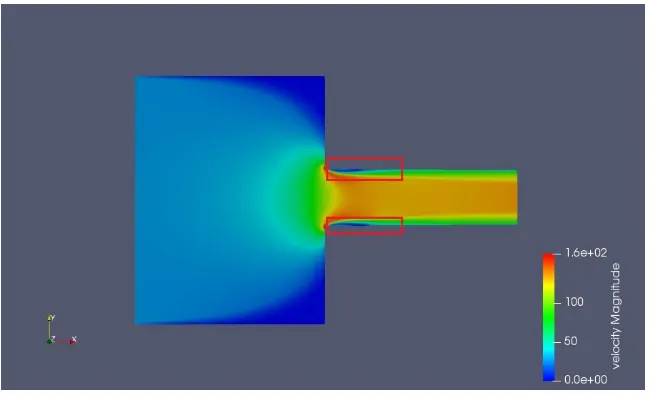
2.Pressure difference 70 bar:
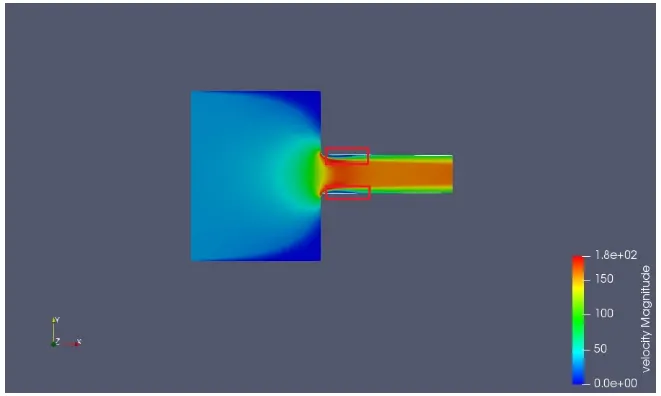
3.Pressure difference 100 bar:
Conclusion:
2D cavitaion simulation in Winkyl-Hoffer geometry was performed successfully.