Week-11 Challenge: Braking
1. For a defined driving cycle, calculate the energy required for braking.
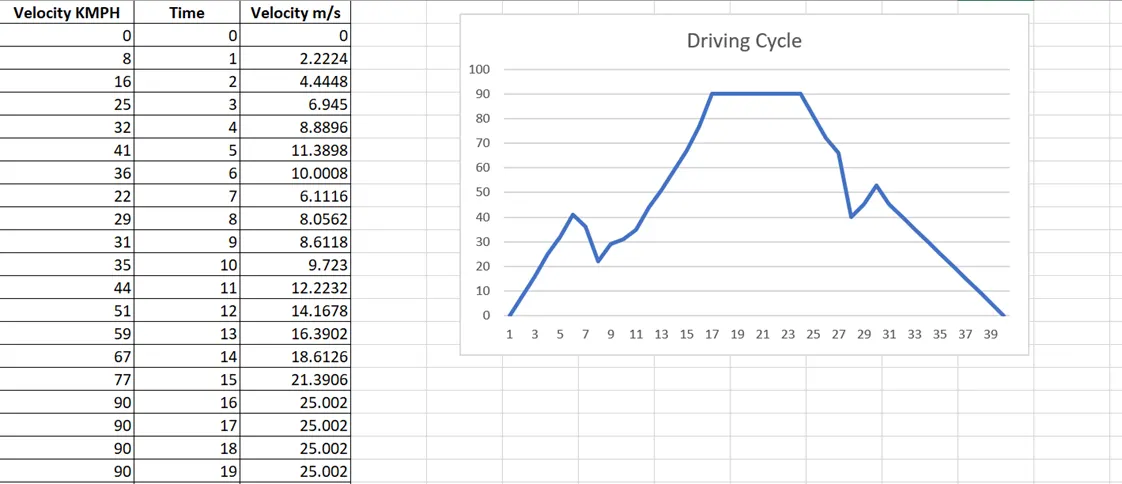
From the graph, let us analyse few instants of braking to find the braking energy.
1. 41 km/hr to 22 km/hr in 2 sec
2. 90 km/hr to 40 km/hr in 4 sec
3. 53 km/hr to 0 km/hr in 10 sec
Braking energy is given by the expression,
Eb = ½ * Mass * (Vi2 – Vf2)
Where,
Eb – Braking Energy
Mass – Vehicle mass
Vi – Initial Velocity
Vf – Final Velocity
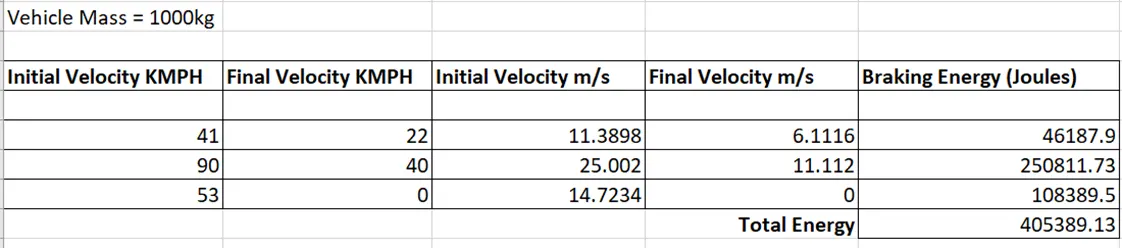
Total Braking Energy of the above Driving cycle is: 405.38913 KJ
2. Why electric motor can’t develop braking torque at high speed similar to starting? How electric and mechanical brakes are coordinated?
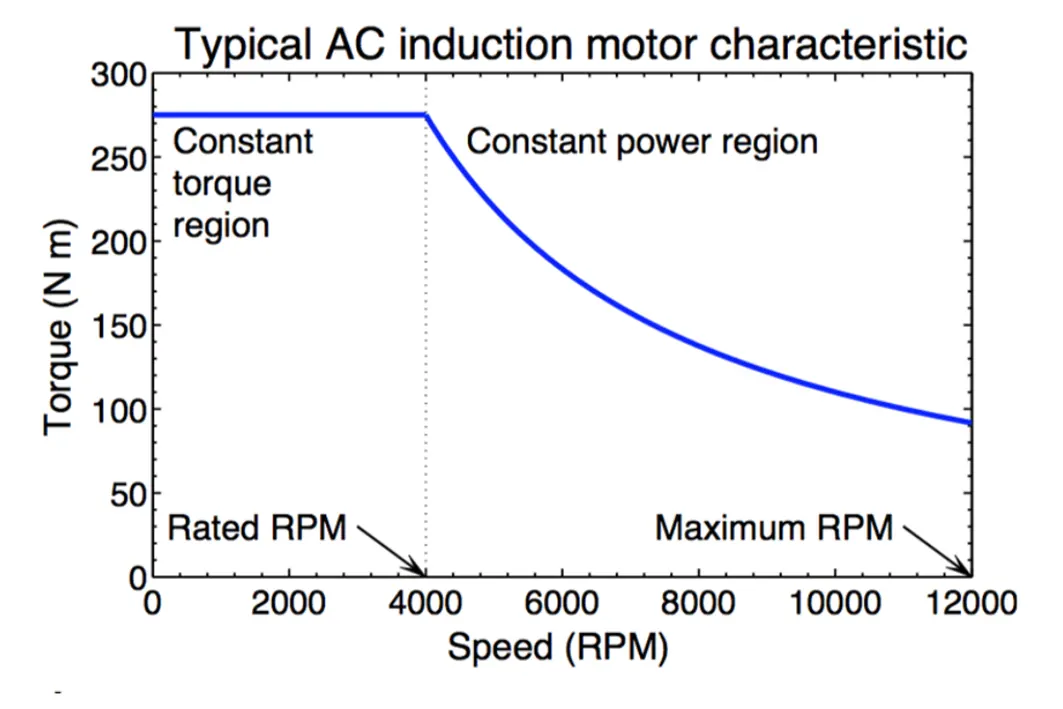
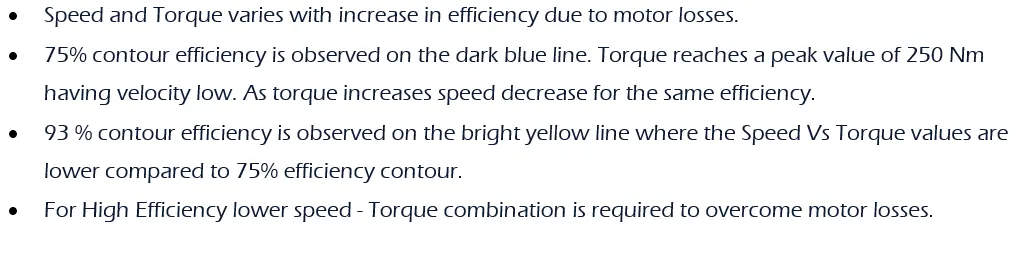
It is clear from the Torque Speed characteristics curve of AC induction motor that Torque produced at constant power region (Region where the torque decreases and Peak motor power is generated) is very low thus making it difficult to develop adequate braking torque in this region. Braking Torque produced increases with decrease in speed.
How electric and mechanical brakes are coordinated?
Electric vehicles have 2 types of braking system one is electric braking system and mechanical braking system.
Electric Braking system:
In electric braking, the motor is made to work as generator. So, it produces a negative slip and negative torque (braking torque). This is achieved by suitably changing the electrical connections of the motor. It uses the winding of the motor to produce braking torque which opposes the motion of the shaft rotation.
· Highly efficient method.
· The energy of the rotating parts can be converted to electrical energy which can be utilized or returned to the supply mains.
· Braking is very smooth, without snatching.
· Less maintenance - because of absence of mechanical equipment.
Mechanical Braking System:
It uses Frictional force between the rotating pars and the brake drums to produce required braking. Mechanical equipment such as brake linings, brake shoes and brake drums are required.
· Low efficient
· The energy of the rotating parts is wasted as heat in friction.
· Depending upon the conditions the braking may not be very smooth.
· Frequent maintenance - like adjustment of brakes, replacement of brake linings. They are prone to tear & wear.
At high speed, braking torque is very less so mechanical brakes are applied to slow down the vehicle. At constant torque region the regenerative braking system comes in and motor acts as generator and negative torque is produced to charge battery.
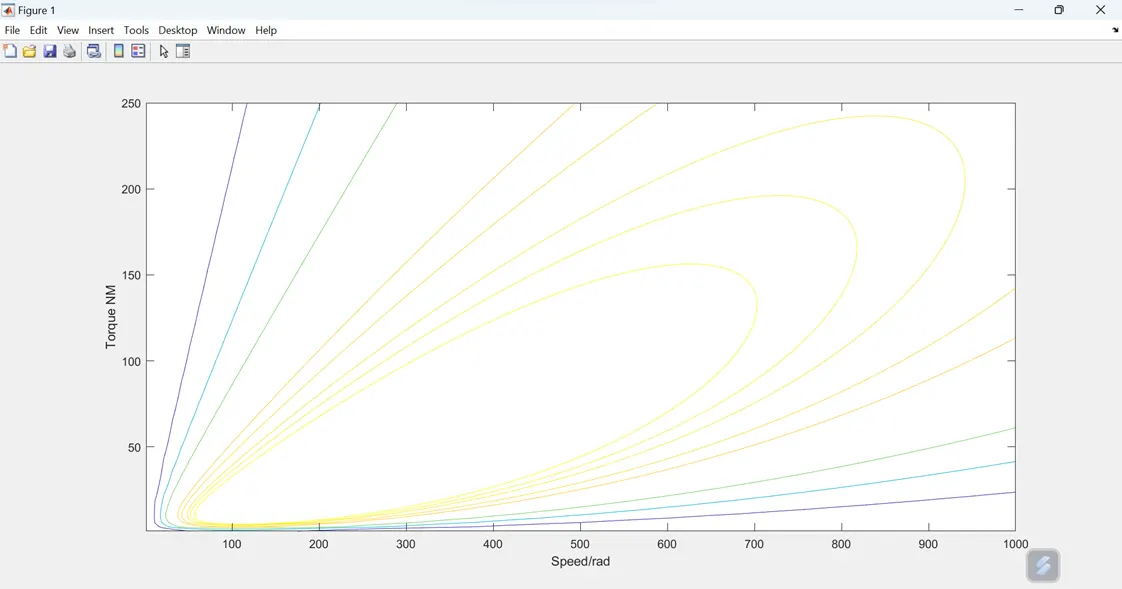
3. Make a MATLAB program which plots contour of given motor speed, torque and efficiency values. Attach the code as a .m file attach a screenshot of all the plots.
The efficiency Map of the electric motor consist of a contour plot of torque Vs Speed. It gives information of the efficiency range at a different combination of speed and torque. It is necessary to consider the Iron, Copper, Windage and constant motor losses
% A Program for Plotting efficiency contour for Electric motor.
% The X axis corresponds to motor speed (w) and Y axis Torque (T).
% First, Setup arrays for range.
x = linspace(1,1000); % Speed rad/s
y = linspace(1,250); % 0 to 40 NM
% Allocate motor loss constant
Kc = 0.2; % For copper losses
Ki = 0.008; % For Iron losses
Kw = 0.00001; % For Windage losses
ConL = 20; % For Constant motor losses
% Now Makes mesh
[X,Y] = meshgrid(x,y);
outputpower = (X.*Y); % Torque x Speed = Power
B = (Y.^2) * Kc; % Copper losses
C = X * Ki; % Iron losses
D = (X.^3) * Kw; % Windage losses
InputPower = outputpower + B + C + D + ConL;
Z = outputpower./InputPower;
% We now set Efficiency for which a contour will be plotted
V = [0.70,0.80,0.85,0.90,0.91,0.92,0.925,0.93];
box off
grid off
contour(X,Y,Z,V);
xlabel('Speed/rad');
ylabel('Torque NM');
hold on