Week-11 Challenge: Braking
1.For a defined driving cycle, calculate the energy required for braking.
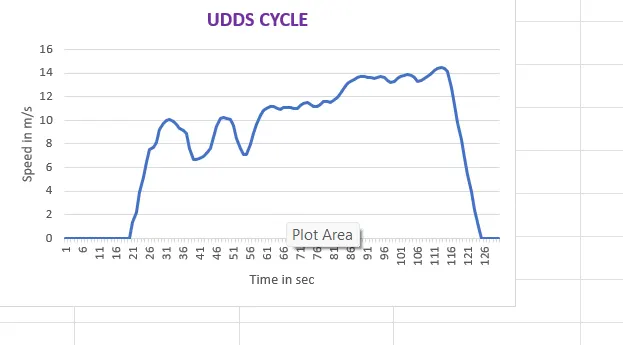
The driving cycle taken into consideration is the UDDS cycle which stands for Urban Dynamometer Driving Schedule. Although the data is taken for a total driving time for 1370s, for simplicity sake on 150s of driving time is considered. The speed which is in miles per hour has been converted to meters per second.
The drive cycle is given below.
The equation for kinetic energy from braking is given as,
E = 1/2*m(Vi-Vf)^2
Where,
m = Mass of the vehicle in Kg.
Vi = Initial speed of the vehicle in m/s.
Vf = Final speed of the vehicle in m/s.
From the drive cycle 10 braking points were obtained. The mass is set at a constant 1500 Kg. The energy required for braking is given in the table below.
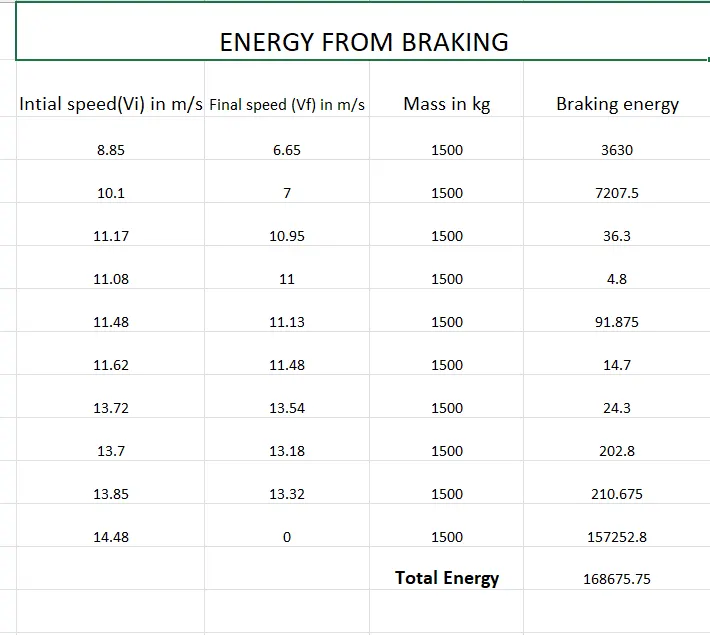
Therefore the total energy required for braking is 16.8KW.
2.Why electric motor can’t develop braking torque at high speed similar to starting? How electric and mechanical brakes are coordinated?
Let us consider the torque speed characteristics
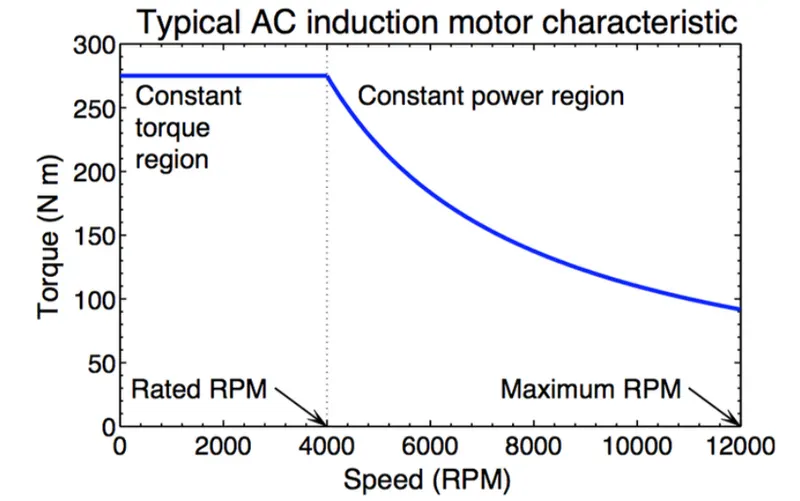
From this curve we have two region, constant torque and constant power region. At the start the motor achieves peak torque till it reaches a certain motor speed range from where it will rapidly drop. The reason due to the drop in torque is due to the motor shaft reaching critical speed and the area where the peak torque is constant is known as the constant torque region of the motor. The region where the torque decreases is known as the constant power region as the power generated by the motor will be at it's peak.
Since the torque produced at the constant power region is very low, it is not possible to develop enough braking torque in this region. The braking torque produced increases as the speed decreases.
How are electric brakes and mechanical brakes co-ordinated?
In electric vehicles, two types of braking systems are used electric brake system and mechanical brake system.
Electric Braking System In electrical braking, the winding of the motor is used to produce a braking torque. A braking torque is developed during the braking operation. This braking torque opposes the motion of the rotating member or shaft. This is achieved by suitably changing the electrical connections of the motor. The motor operates on a speed–torque characteristic, depending upon the method of braking employed.
Mechanical Braking System In mechanical braking, the frictional force between the rotating parts and the brake drums produces the required braking. To achieve this, mechanical equipment, such as brake linings and brake drums, are required. Whether electrical or mechanical, the braking of the drive should stop the motor at the specified point of time and position.
The electric braking system used in EVs and HEVs is regenerative braking. This method uses the motor as a generator during braking, developing a retarding torque, which acts on the running motor and halts it. The kinetic energy and potential energy, minus the losses of the motor are returned to the mains and the motor runs at a constant speed. Thus, regenerative braking eliminates the tendency of the load to accelerate the motor.
Mechanical braking systems used can be either disc or drum brake system. Where in case of a disc brake system friction pads rub against a disc when the brake pedal is applied and the kinetic energy is converted to heat and slows the vehicle down. In a drum brake system a set of brake shoes which are the friction materials press against a drum.
Since the braking torque is very less at high speeds, mechanical brakes are applied to slow down the vehicle. As the motor reaches the constant torque region the regenerative braking system takes effect where the motor acts as a generator and the negative torque produced charges the battery pack.
3.Make a MATLAB program which plots contour of given motor speed, torque and efficiency values. Attach the code as a .m file attach a screenshot of all the plots.
An efficiency map of an electric motor is a contour plot of torque and speed. It is used to describe the speed and torque combinations required at different efficiency ranges. In order to model the efficiency contour we must consider the losses that occur in electric motors and these losses are,
Iron or Core Losses Iron losses are made of two components which are hysterisis and eddy currents. Hysteresis losses occur as we switch the electromagnets in our motor on and off, and depends on the magnetic properties of the iron mateiral used in the motor. Eddy current losses depend on many variables, including the thickness of the laminations in the stator, the frequency at which the motor operates, the flux density and the material's resistivity. The iron losses are proportional to the square of the lamination thickness.
Copper or Variable Losses Copper losses are due to the resistance of the copper conductors and the current that we ask them to carry, and they lead to heating of the conductors. Of course, because copper is heavy, we want to use as little of it as possible, minimising cross-sectional area. This increases resistance and therefore increases losses and heating.
Windage Losses The loss caused by air friction between rotor and surrounding air is called windage losses. It occours due to air resistance to the armature. Higher the speed of the motor more wil be the windage losses.
Based on these 3 losses the MATLAB program to plot the efficiency contour is written below.
% Motor efficiency contour.
clear all;
close all
clc
% Defining the speed and torque as arrays.
x = linspace(1,1000); % Motor speed in rad/s
y = linspace(1,250); % Motor torque in N-m
% Motor loss constants
Kc = 0.2; % Copper losses constant
Ki = 0.008; % Iron losses constant
Kw = 0.00001; % Windage losses constant
ConL = 20; % Constant motor losses
[X,Y] = meshgrid(x,y); % To create a 3D array
Output_power = (X.*Y); % Power equation
C_l = (Y.^2)*Kc;% Copper losses equation
I_l = X*Ki; % Iron losses equation
W_l = (X.^3)*Kw;% Windage losses equation
Input_power = Output_power + C_l + I_l + W_l + ConL;
Z = Output_power./Input_power; % Efficiency
V = [0.7,0.8,0.85,0.9,0.91,0.92,0.925,0.93]; % Mapping the contours of the efficiency
% Plotting the contour
box off
grid off
contour(X,Y,Z,V);
xlabel('Speed in rad/s');
ylabel('Torque in N-m');
legend('0.7,0.8,0.85,0.9,0.91,0.92,0.925,0.93');
hold on
Explanation of the code,
1.First the clear all, close all and clc commands are written to clear all variables in workspace, to clear all plots and to clear the workspace respectively.
2.The speed and torque are defined as 2-Dimensional linearly spaced arrays using the linspace command.
3.The constants of the motor losses are defined.
4.The 2-D arrays of the speed and torque are then defined as 3-Dimensional arrays using the meshgrid command.
5.The output power equation is defined as the product of speed and torque.
6.The equations of the motor losses based on the speed and torque are defined.
7.The input power is defined as the sum of output power plus motor losses.
8.The efficiency is then defined as the ratio of output power to input power.
9.In order to map the contour for different efficiency ranges an array is defined which consists of the efficiencies from 0.7 to 0.93.
10.The graph is plotted using the contour command to plot the speed, torque, and efficiency.
The contour plot of the above MATLAB program is given below,
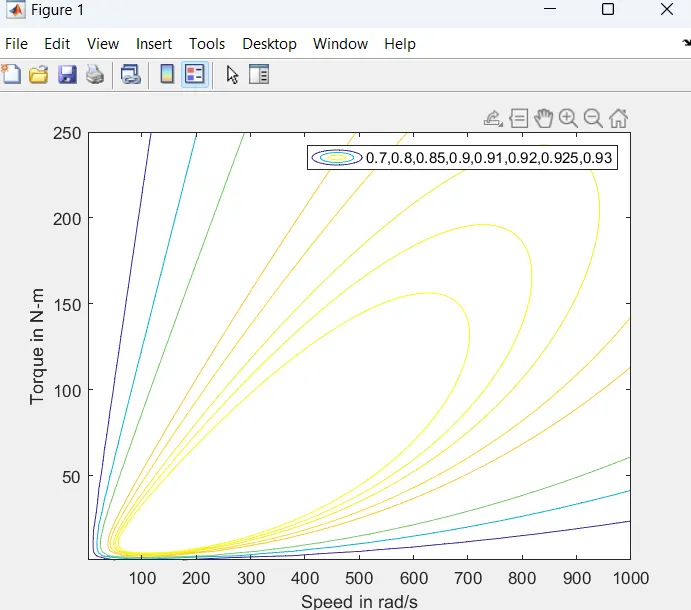
From the plot it can be observed that the speed and torque varies as the efficiency increases. This is due to the motor losses that occur. The dark blue line represent the contour 70% efficiency and the bright yellow line represents the contour 93% efficiency.
For example at 70% efficiency, the torque reaches it's peak value of 250 N-m when the vehicle is a very low speed but the torque decreases significantly as the speed increases for the same efficiency. And at a motor efficiency of 93% the speed and torque required is much less compared to an efficiency of 70%.
Greater the motor efficiency, lower speed-torque combination is required to overcome the motor losses
CONCLUSION
The energy required for braking of a vehicle based on a drive cycle is calculated.
The co-ordination between electric brakes and mechanical brakes and why braking torque is less at high speed are explained.
The MATLAB program to plot the speed, torque and efficiencies contour is written and the graph is plotted.