Week-11 Challenge: Braking
1. For a defined driving cycle, calculate the energy required for braking.
Here have taken the drive cycle data from a website the link is attached below. We have used NEW YORK CITY DRIVE CYCLE for our calculation.
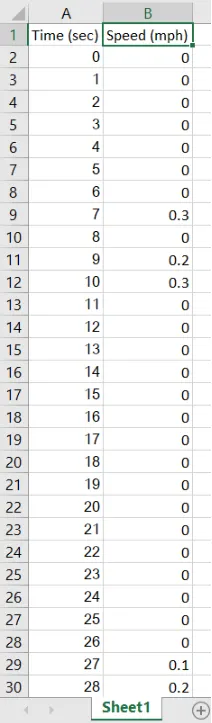
The graph is given below,
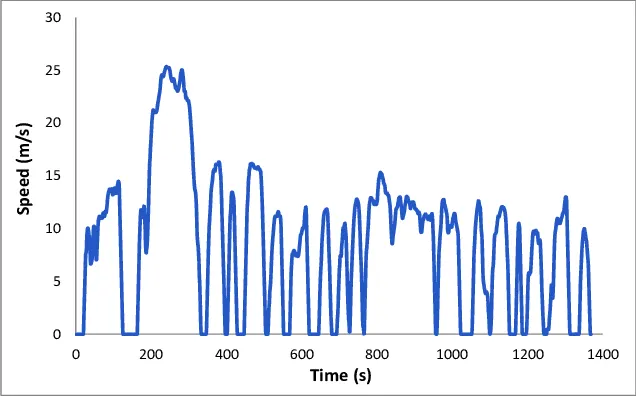
Now we are going to calculate Braking energy by this vehicle during this whole driving cycle.
Parameters:
M: Mass : 800kg
Vf: Final velocity: Here the minimum velocity obtained after braking is considered as final velocity.
Vi: Initial velocity: Here the maximum velocity obtained before braking is considered as initial velocity.
Formula:

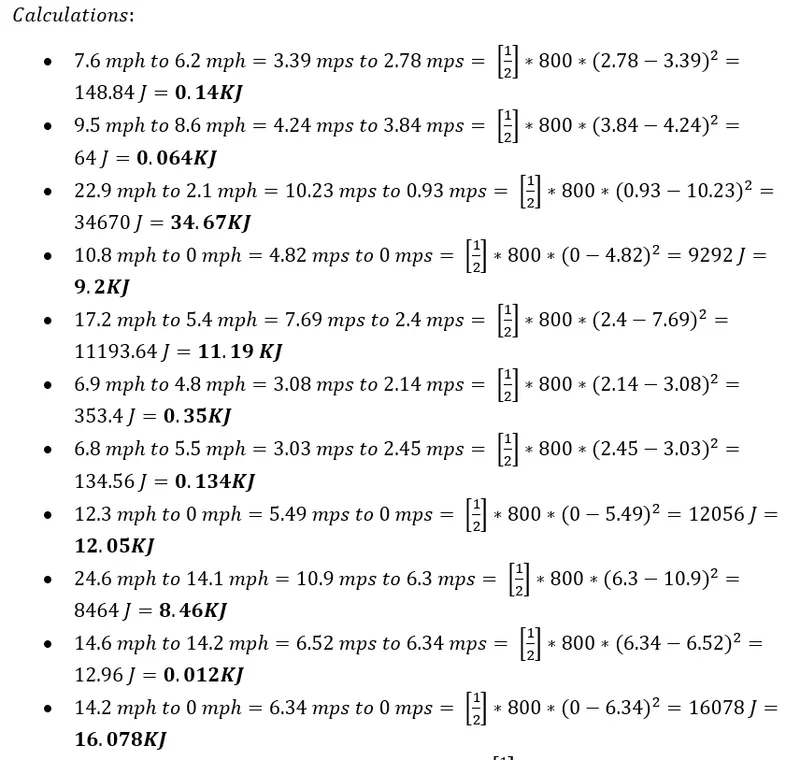
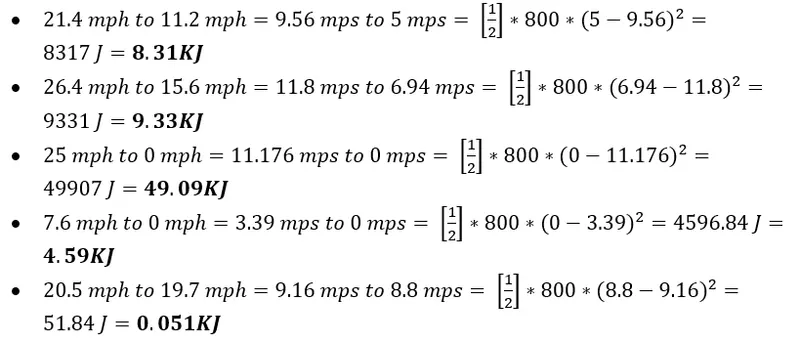
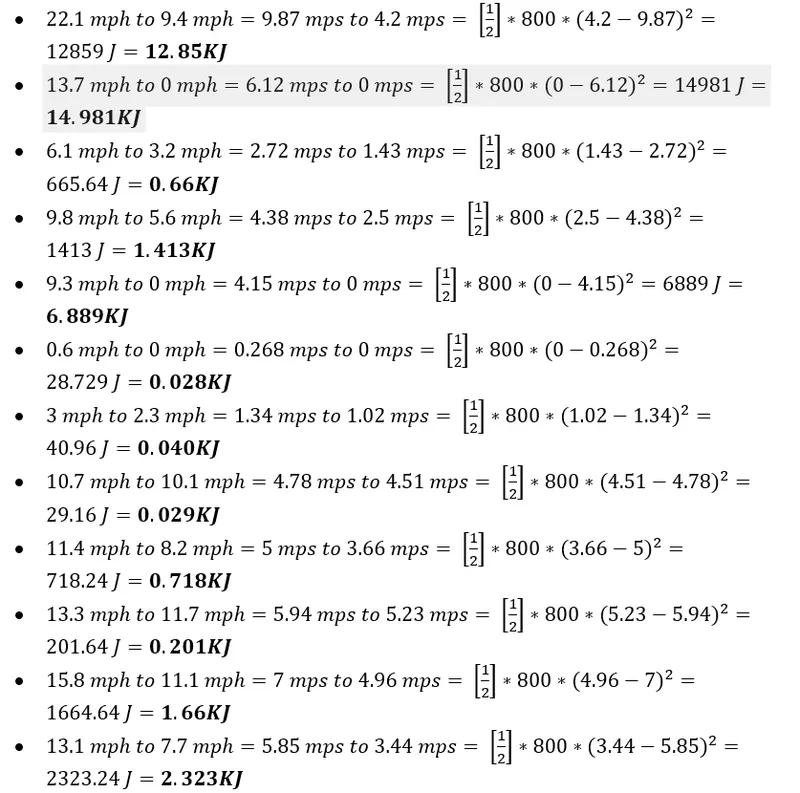
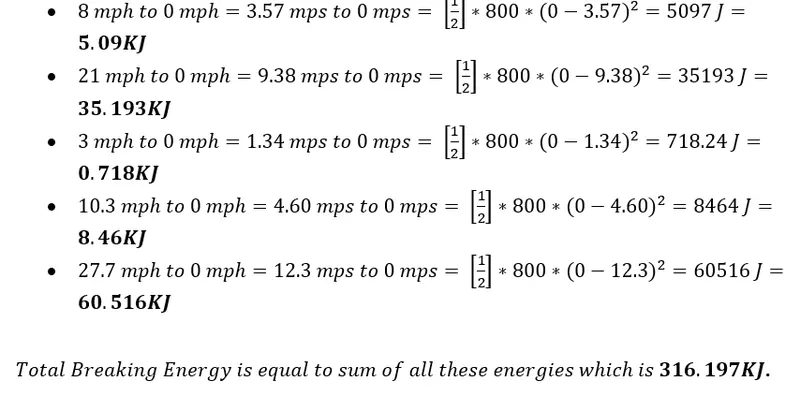
33 decelerations were made during this driving cycle, So 33 braking energy is to be calculated and sum it up to get the Total braking energy.
Calculations:
2. Why electric motor can’t develop braking torque at a high speed similar to starting? How electric and mechanical brakes are coordinated?
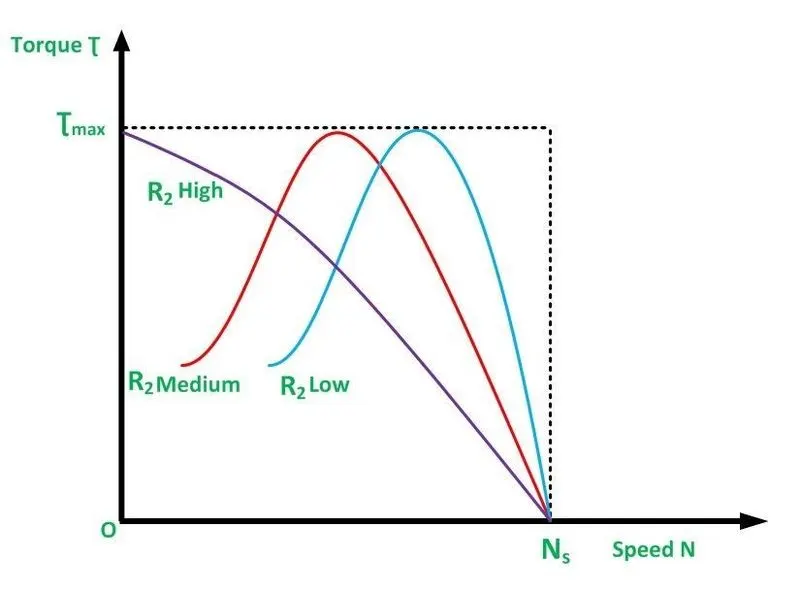
An electric motor is designed to generate torque by applying an electric current to its windings, which then creates a magnetic field that interacts with the rotor. At low speeds, the magnetic field has a greater effect on the rotor, resulting in high torque output. However, as the speed of the motor increases, the effect of the magnetic field on the rotor decreases, causing a reduction in torque output.
Moreover, an electric motor is not capable of generating braking torque at high speeds due to its inherent limitations. Braking torque is generated by reversing the direction of the magnetic field in the motor's windings. At high speeds, the windings cannot reverse the magnetic field quickly enough to generate significant braking torque. Therefore, mechanical brakes are necessary to stop the motor at high speeds.
It is important to note that electric and mechanical brakes can be used in conjunction with each other in a coordinated fashion, depending on the specific application. In some cases, electric brakes can be used to slow down the motor to a certain speed, after which mechanical brakes take over to bring the motor to a complete stop. In other cases, both types of brakes can be used simultaneously to provide greater stopping power. The coordination between electric and mechanical brakes can be achieved through the use of control systems, such as electronic braking systems (EBS) or anti-lock braking systems (ABS), which monitor the speed and torque of the motor and adjust the brake force accordingly.
In conclusion, electric motors cannot develop braking torque at high speeds similar to starting due to their design limitations. However, the integration of mechanical brakes and the coordination of electric and mechanical braking systems can provide efficient and effective stopping power for electric motors operating at high speeds.
3. Make a MATLAB program which plots contour of a given motor speed, torque, and efficiency values. Attach the code as a .m file attach a screenshot of all the plots.
clear all
close all
clc

x=linspace(1,1000,250); %Speed in rad/sec
y=linspace(1,250,250); %Torque in Nm

%Motor loss constants
kc=0.2;  %Copper loss constant
ki=0.008;  %Iron loss constant
kw=0.00001;  %Windage loss constant
Const_Loss=20;  %Constant motor loss

[X,Y]=meshgrid(x,y); %Converting to 2D
Output_power=(X.*Y); %Power = Torque x Speed

B= (Y.^2)*kc; %Copper loss
C= X.*ki; %Iron loss
D= (X.^3)*kw; %Windage loss
Input_power = Output_power + B + C + D + Const_Loss;
Efficiency= Output_power./Input_power; %Eff of the motor
V = [0.70,0.80,0.90,0.91,0.92,0.925,0.93]; %Efficiencies to be plotted
box off
grid off
contourf(X,Y,Efficiency,V);
contourcbar
title('Speed-Torque-Efficiency Characteristics of Motor');
xlabel('Speed (rad/sec)');
ylabel('Torque (Nm)');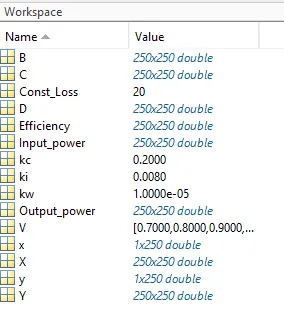
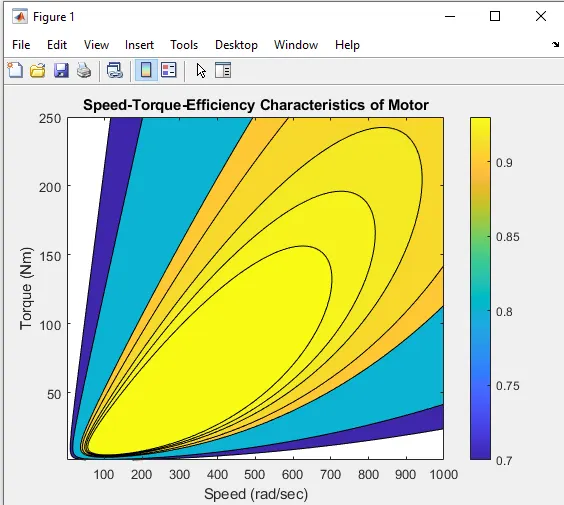
Description:
1. Here in this program, first two inputs were given. They are Speed & Torque using linspace command.
2. Then the motor constant values are assigned namely Copper loss, Iron loss, Windage loss, and Constant motor.
3. Then mesh grid is used to evaluate the functions of two variables and three-dimensional mesh/surface plots.
4. Output Power is calculated by multiplying speed and torque.
5. Then all the losses were calculated and the input powers were also calculated.
6. Then comes the efficiency calculated. And Contour graph is plotted between Speed, Torque, and Efficiency.