Week-11 Challenge: Braking
1)For a defined driving cycle, calculate the energy required for braking
For this challenge i have considered UDDS drive cycle, the required data has been copied from the website and transferred the following into excel sheets.
we need to calculate the total deceleration and total energy required for braking
the following code shows the steps how to calculate the following through data sheet of drive cycle
clear all
close all
clc
%variables
m = 1000;
x = readmatrix('UDDS.xlsx');
time = x(1:1370,1);
velocity =x(1:1370,2);
Time = 1370;
%converting velocity from mph to kmph
v = velocity.*0.447;
% creating for loop to calculate the braking for decelartion
deceleration = zeros(1,Time);
braking_eng = zeros(1,Time);
for i = 1:(length(v)-1)
    if v(i)>v(i+1)
        deceleration(i) = v(i+1) - v(i)/ time(i+1) - time(i);
        braking_eng(i) = 0.5*m*((v(i))^2-(v(i+1))^2)/3600;
    end
end
%plotting
subplot(3,1,1)
plot(time,velocity)
xlabel('Time (sec)');
ylabel('velocity (kmph)');
title('UDDS drive cycle');

subplot(3,1,2)
plot(time,deceleration)
xlabel('time (sec)');
ylabel('Deceleration (m/s^2)');
title('Deceleration in the drive cycle');

subplot(3,1,3)
plot(time,braking_eng)
xlabel('time (sec)');
ylabel('Braking energy (w.h)');
title('Braking energy in the drive cycle');
Matlab function readmatrix:
This creates an array by reading column-oriented data from a file. The readmatrix function performs automatic detection of import parameters for your file.
this function can be used to load the data file directly rather than uploading the data into the matlab itself, this function automates by fetching the location of the file and loading the data.
for this function to work the file have to be loaded in the Matlab folder section.
the following outputs are obtained:
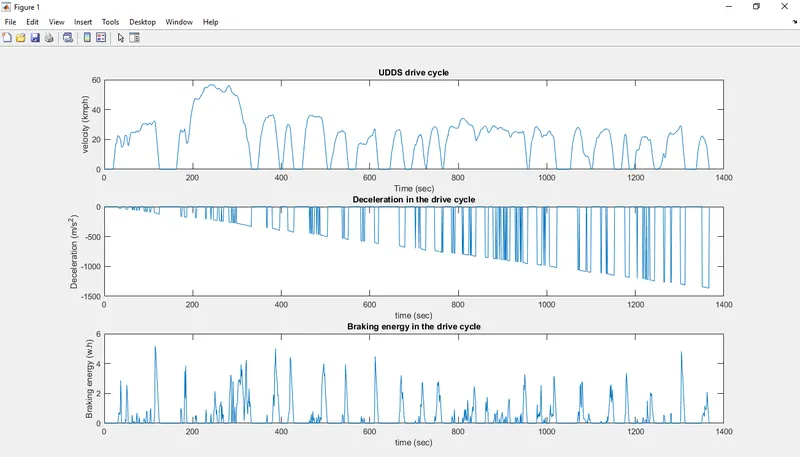
braking energy is calculated for all the points where deceleration occurs and total deceleration has been plotted.
the total braking energy required for UDDC drive cycle is 582.792901 (w.h)
2) Why electric motor can’t develop braking torque at high speed similar to starting? How electric and mechanical brakes are coordinated?
BRAKING:
A brake system is designed to slow and halt the motion of vehicle. To do this, various components within the brake system must convert the vehicle’s moving energy into heat. This is done by using friction.
Friction is the resistance to movement exerted by two objects on each other. Two forms of friction play a part in controlling a vehicle: Kinetic or moving, and static or stationary.
Thus, in a nutshell, a car brake works by applying a static surface to a moving surface of a vehicle, thus causing friction and converting kinetic energy into heat energy.
MECHANICAL BRAKING:
Mechanical brakes all act by generating frictional forces as two surfaces rub against each other. The stopping power or capacity of a brake depends largely on the surface area of frictional surfaces as well as on the actuation force applied. The friction and wear encountered by the working surfaces are severe. Thus, the durability of a brake or service life between maintenance depends heavily on the type of material used to line the shoe or pad.
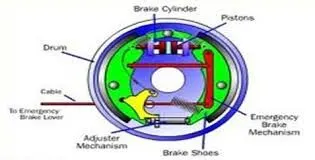
Mechanical brakes are assemblies consisting of mechanical elements for the slowing or stopping of shafts in equipment drives. They use levers or linkages to transmit force from one point to another. Braking slows or stops the movement of the coupled shafts. There are several types of mechanical brakes. Band brakes, the simplest brake configuration, have a metal band lined with heat and wear-resistant friction material. Drum brakes, which are commonly used on automobile rear wheels, work when shoes press against a spinning surface called a drum.
Disc brakes are constructed of brake pads, a caliper, and a rotor. During operation, the brake pads are squeezed against the rotor. Cone brakes are made with a cup and a cone, which is lined with heat and wear-resistant material. During actuation, the cone is pressed against the mating cup surface.
ELECTRICAL BRAKING:
Electrical braking is used to reduce the speed of the machine depending on flux and torque. This type of braking is mainly used for functional braking to control the speed of the machine. It is easy to handle and comfortable. But it cannot be used for emergency braking and parking braking.
The working of electrical braking depends on the electromagnetic force (EMF) acting on the brake shoes. The battery is used to generate an electric current which helps to energize the electromagnet mounted on the backplate. This results in activating the cam and expanding the brake shoes. Hence the vehicle or machine is stopped by braking the wheel.
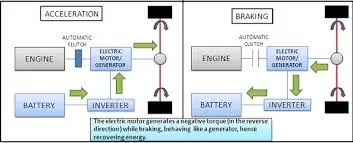
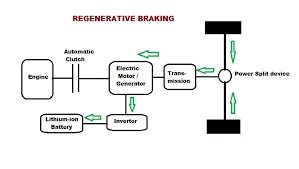
Regenerative braking:
When the rotor rotates higher than the speed of the synchronous speed, then the motor acts as a generator and the directions of current flow and the torque are reversed. Hence the generator is stopped by braking. The main disadvantage is, when the motor exceeds the synchronous speed, it is possible of mechanical and electrical damage. So, regenerative braking can be done at the sub-synchronous speed only when the variable frequency source is applied.
Plugging type braking:
the pedal is used for braking the vehicle. When the pedal is pressed, the speed of the electric vehicle is reduced by changing the polarity and direction of the motor. The direction of the motor gets reversed and inturn causes braking the wheel.
In generators, the use of the plugging type braking system results in decreased speed due to the reversal of terminals of the supply, reversal of torque, and restriction of rotation of the motor. An external resistor is used to limit the current flowing through the plugging circuit. The more power is wasted during the plugging.
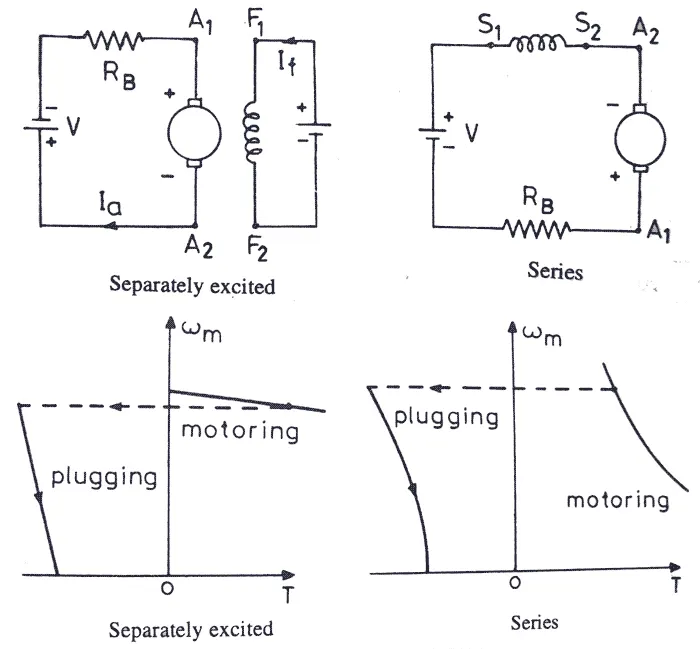
plugging type regenerative braking
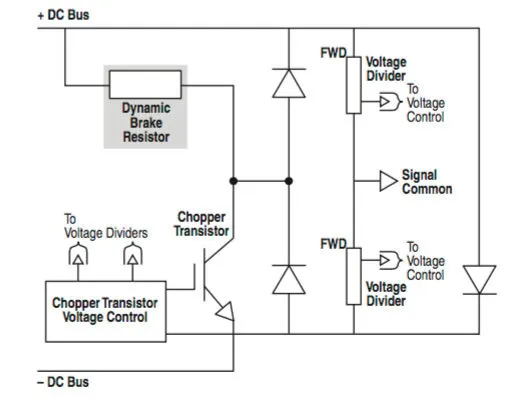
Dynamic braking:
the resistance is provided to the motor by the rheostat connected to the circuit is capable of acceleration or deceleration of the vehicle. This resistance helps to reduce the speed and stops the electric vehicle. The resistor or rheostat in the circuit dissipates excess energy on the capacitor by connecting a resistor in parallel with the capacitor.
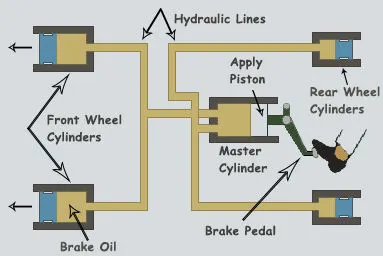
Hydraulic braking:
the resistance is provided to the motor by the rheostat connected to the circuit is capable of acceleration or deceleration of the vehicle. This resistance helps to reduce the speed and stops the electric vehicle. The resistor or rheostat in the circuit dissipates excess energy on the capacitor by connecting a resistor in parallel with the capacitor.
Brake control systems:
The starting torque of a motor is the torque developed by the motor at no speed and this is a moderately high value. At high speeds, electric motors cannot develop braking torques compared to their starting torques, this is because the greater the speed of the vehicle, the greater will be the braking torque required. however, when a motor is starting its starting torque i.e torque at no speed is the highest it can be. This can be explained by the speed-torque characteristics of a motor. The plot will show a straight line with a slight negative gradient and this is plotted in the first quadrant i.e the forward motoring region that is why the torque generated at the starting will not be similar to the braking torque. Also, at higher speeds, the terminal voltage source increases and so the torque values will differ further from the starting torque.
3)Make a MATLAB program which plots contour of given motor speed, torque and efficiency values. Attach the code as a .m file attach a screenshot of all the plots.
- Considerations:
copper loss (kc) = 0.2
iron_loss ( Ki) = 0.008
windage loss (kw) = 0.00001
Constant Loss = 20
The equation of loss is given below
clear all
close all
clc
w = linspace(0,1000);
T = linspace(0,300);
kc = 0.2;
ki = 0.008;
kw = 0.00001;
ConL = 20 ;
[X,Y] = meshgrid(w,T);
copper_loss = (Y.^2)*kc;
iron_loss = X*ki;
windage_loss = (X.^3)*kw;
o_p = X.*Y;
input_power = copper_loss+iron_loss+windage_loss+o_p+ConL;
eff = (o_p)./(input_power);
n = linspace(0.7,0.95,10);
contour (X,Y,eff,n)
title('Speed vs torque')
xlabel('speed (Rads/sec)')
ylabel('torque (Nm)')
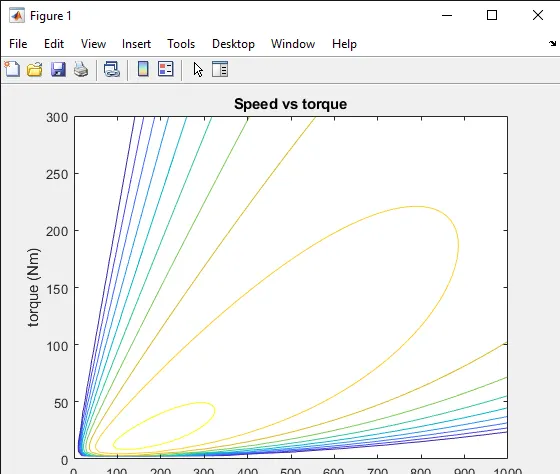
From the above contour plot, we can presume that the innermost contour will have the highest efficiency and as the contours move farther away the efficiency falls, we can also see that each contour represents efficiency.