Week-11 Challenge: Braking
Week-11 Challenge: Braking
- For a defined driving cycle, calculate the energy required for braking.
Aim: To calculate the energy required for braking in a specific driving cycle.
Consider UDDS cycle data and try to estimate the initial and final velocities during braking action from the driving cycle plot.
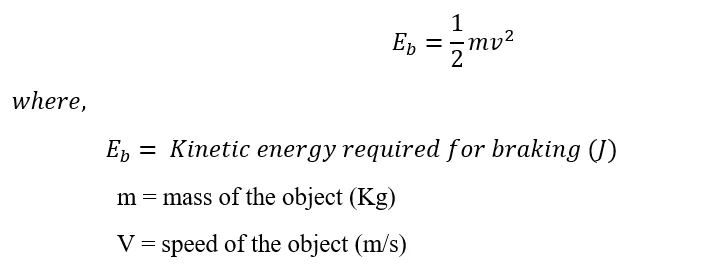
The energy consumed is determined by the fundamental formula
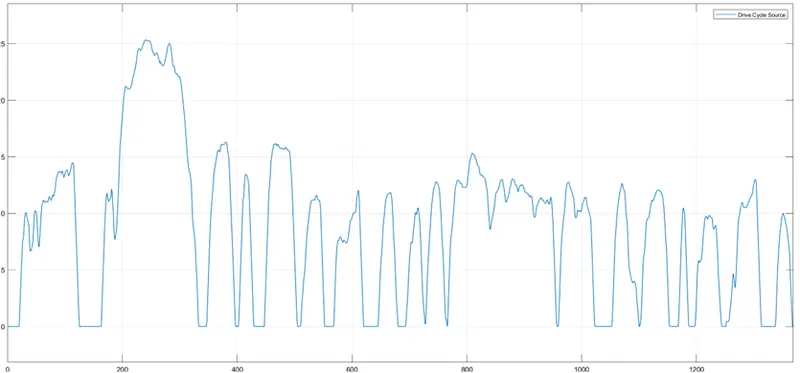
The drive cycle of UDDS is shown in above figure.
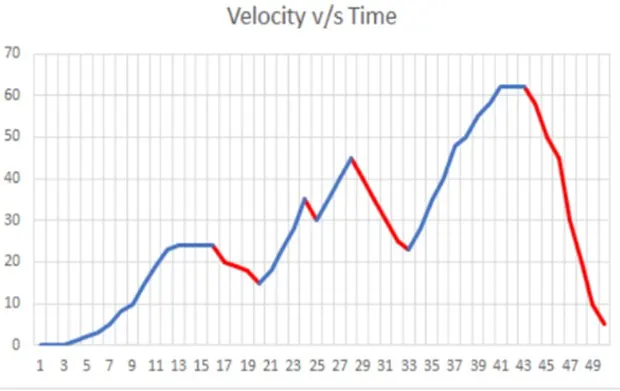
The UDDS average drive cycle is shown in above figure.
From the above drive cycle UDDS, it is observed that deceleration and braking are applied at four different times in the overall cycle.
Braking-1 = 24-15kmph in 5 sec
Braking-2 = 35-30kmph in 1 sec
Braking-3 = 45-23kmph in 5 sec
Braking-4 = 62-5kmph in 7 sec
The energy required at braking-1:
Considering
Curb weight of the vehicle (kg) = 1500
Payload on the Vehicle (kg) = 250
Total mass (kg) = 1750
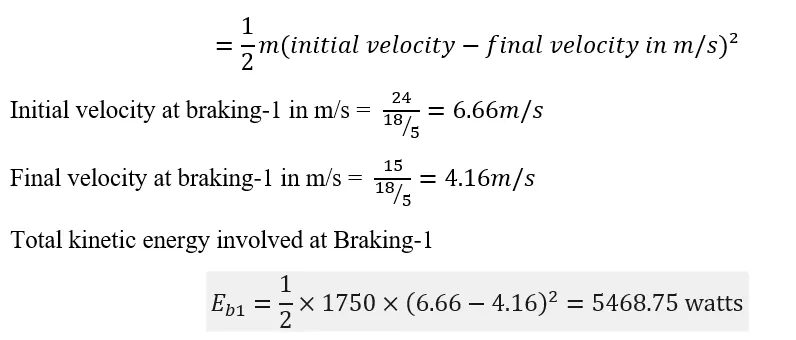
Total kinetic energy involved at Braking-1
Initial velocity at braking-1 in m/s =
Final velocity at braking-1 in m/s =
Total kinetic energy involved at Braking-1
Initial velocity at braking-1 in m/s =
Final velocity at braking-1 in m/s =
Total kinetic energy involved at Braking-1
Initial velocity at braking-1 in m/s =
Final velocity at braking-1 in m/s =
Total kinetic energy involved at Braking-1
Initial velocity at braking-1 in m/s =
Final velocity at braking-1 in m/s =
Total kinetic energy involved at Braking-1
similarly for
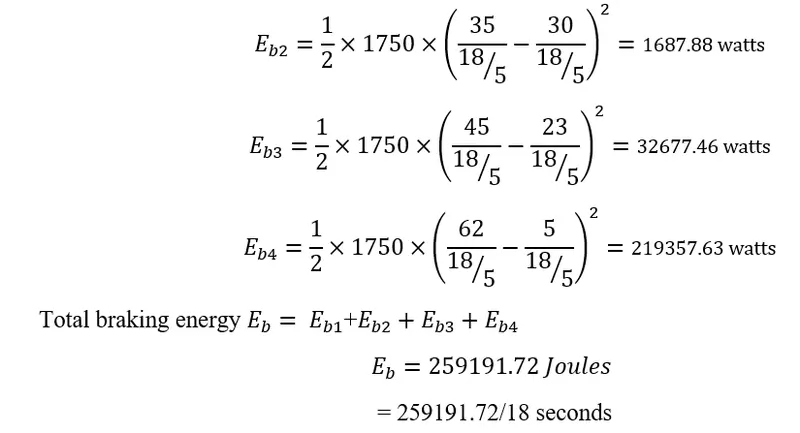
= 14399.54 joules/ sec (or) watts
=14.399 Kw consumed in 18 secs or 0.005 hours
Total Braking energy consumed (KWH) = 0.071995 KWH
Note: The same calculation can also be carried out using a simple excel sheet calculator.
2. Why electric motor can’t develop braking torque at high speed similar to starting? How electric and mechanical brakes are coordinated?
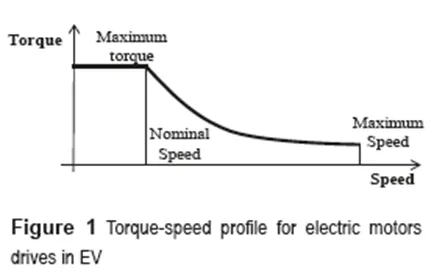
This can be better convinced by considering speed-torque characteristics of AC induction motor.
Explanation:
During regenerative braking, the traction motor of EV acts as a generator when brakes are applied or during coasting period or deceleration time, to supply energy from the vehicle’s moment of inertia the to energy storage system (ESS), it helps in an effective approach to extend the driving range of an EV.
- Regenerative braking torque cannot be made large enough to provide all the required braking torque of the vehicle as it might lead to the deterioration in the stability of the vehicle, also as compared to the torque values at an acceleration of motor is much higher than torque at a deceleration of the vehicle.
- At higher speeds of motor i.e., at higher vehicle speed, according to speed-torque characteristics, the motor runs at constant power region where the torque is very low which is not very useful for torque required for regenerative braking. Hence the peak value of acceleration torque and braking torque are not same.
Co-ordination Between Electric & Mechanical Braking:
The regenerative braking system cannot come into the picture in many conditions, such as with fully charged battery (SOC-100%) or at high temperature of the battery. In such cases, the mechanical braking systems are the only option to cover the required braking torque.
So that the coordination between the mechanical and electrical braking system plays a important role in designing EV braking control strategies and is also known as torque blending.
The two different control strategies for braking combinations:
- Series control strategy
- Parallel control strategy
Series Control Strategy:
- A combination of a friction-based mechanical braking system with a regenerative braking system that transfers energy to the battery with integrated control, which distributes the required braking force between the regenerative braking system and mechanical braking system.
- Series strategy could give an increase of 15-30% of fuel efficiency and has more consistent braking due to good torque blending characteristics.
Parallel Control Strategy:
Mechanical braking system and regenerative electrical braking system operated simultaneously without an integral control.
Regenerative braking force is added to the mechanical braking force which cannot be controlled.
Regenerative braking is determined by considering the motor capacity, battery SOC, and vehicle velocity. The regenerative braking force is calculated from the brake control unit by comparing the demanded brake torque and the motor torque available.
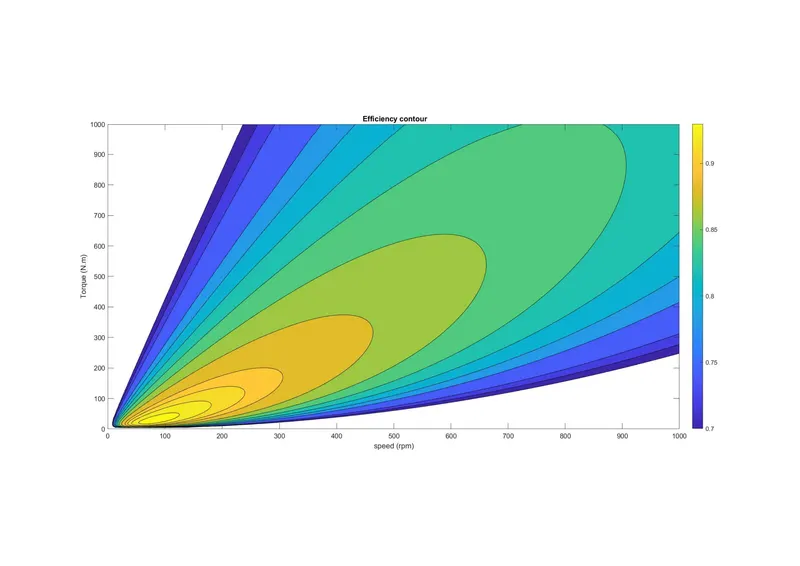
- Make a MATLAB program which plots contour of given motor speed, torque and efficiency values. Attach the code as a .m file attach a screenshot of all the plots.
Consider,
Motor speed -0- 1000rpn
Motor torque -0- 700 N.m
Motor Constants:
Copper loss constant, kc= 0.1
Iron Loss Constant, ki= 0.001
Windage Loss constant, kw=0.0001
Motor Loss Constant, Cm =25
Matlab Code:
clear all
clear all
clc
%defining speed & torque
speed = linspace(0,1000,200);
torque =linspace(0,1000,200);
%defining motor constants
kc = 0.1; % copper loss constant
ki = 0.001; % iron loss constant
kw = 0.0001;% windage loss constant
Cm = 25; % motor loss constant
%obtaining 2-D Grid fpr speed & Torque
[X,Y] = meshgrid (speed,torque);
Powerout=X.*Y; %calculating output power
Totalloss = ((Y.^2).*kc)+(ki.*X)+((X.^3).*kw)+Cm; %total loss calculation
inputpower = Powerout + Totalloss; % Calculating input power
Z=Powerout./inputpower; % Efficiency Calculation
%defining Efficiency levels for contouring,
EL=[0.70,0.72,0.74,0.78,0.80,0.82,0.84,0.86,0.88,0.90,0.91,0.92,0.93,0.94,0.95];
%Plotting teh Efficiency wrt speed & Torque
contourf(X,Y,Z,EL)
colorbar
xlabel('speed (rpm)');
ylabel('Torque (N.m)');
title(' Efficiency contour');
Result:
The contour plot for a motor with defined constants are plotted in the defined speed vs torque region based on efficiency. It can be seen that for increasing speed and torque, the efficiency of the motor gradually decreases. The level of efficiency is depicted using color-bar.