Week-11 Challenge: Braking
AIM:
- For a defined driving cycle, calculate the energy required for braking.
- Why electric motor can’t develop braking torque at high speed similar to starting? How electric and mechanical brakes are coordinated?
- Make a MATLAB program which plots contour of given motor speed, torque and efficiency values. Attach the code as a .m file attach a screenshot of all the plots.
Procedure:
- For a defined driving cycle, calculate the energy required for braking.
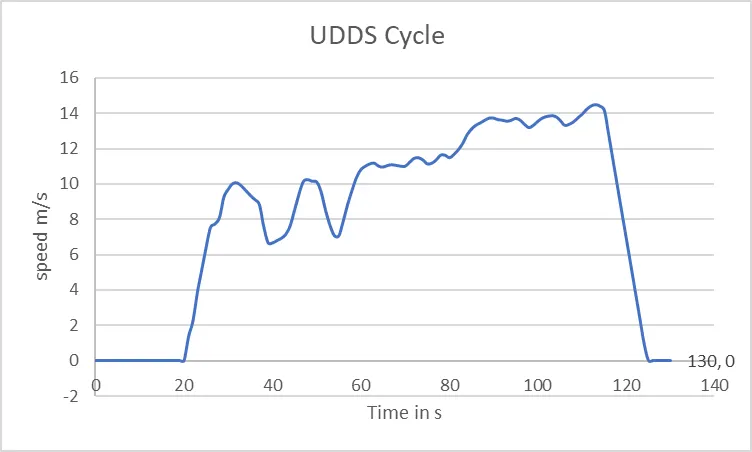
Drive cycle= Urban Dynamometer Driving schedule.
Simplified version of 150 sec driving time is considered and speed converted to meter per sec.
Baking Energy =`1/2*m(V_i-V_f)^2`
Where,
m= mass of the vehicle in kg
Vi= inital speed in m/s
Vf= final speedin m/s
Mass = 1500 kg constant
10 braking points were ontained from driving cycle to calculate braking energy.
| ENERGY FROM BRAKING | |||
| Initial Speed (Vi) in m/s | final Speed (Vf) in m/s | mass in kg | Braking Energy |
| 8.85 | 6.65 | 1500 | 3630.00 |
| 10.1 | 7 | 1500 | 7207.50 |
| 11.17 | 10.95 | 1500 | 36.30 |
| 11.08 | 11 | 1500 | 4.80 |
| 11.48 | 11.13 | 1500 | 91.87 |
| 11.62 | 11.48 | 1500 | 14.70 |
| 13.72 | 13.54 | 1500 | 24.30 |
| 13.7 | 13.18 | 1500 | 202.80 |
| 13.85 | 13.32 | 1500 | 210.67 |
| 14.48 | 0 | 1500 | 157252.80 |
| Total Energy | 168675.75 | ||
Total braking Energy is 16.8 kW
https://docs.google.com/spreadsheets/d/1zZAPRJHszb-BOh4EUaSYjn82EgL3Ms-S/edit?usp=sharing&ouid=107237989211057759444&rtpof=true&sd=true
2. Why electric motor can’t develop braking torque at high speed similar to starting? How electric and mechanical brakes are coordinated?
Solution:
It is clear from the Torque Speed characteristics curve of AC induction motor that Torque produced at constant power region (Region where the torque decreases and Peak motor power is generated ) is very low thus making it difficult to develop adequate braking torque in this region. Braking Troque produced increases with decrease in speed.
How electric and mechanical brakes are coordinated?
Electric vehicles have 2 types of braking system one is electric braking system and mechanical braking system.
Electric Braking system:
In electric braking, the motor is made to work as generator. So it produces a negative slip and negative torque (braking torque). This is achieved by suitably changing the electrical connections of the motor. It uses the winding of the mortor to produce braking torque which opposes the motion of the shaft rotation.
- High efficient method.
- The energy of the rotating parts can be converted to electrical energy which can be utilized or returned to the supply mains.
- Braking is very smooth, without snatching.
- Less maintenance - because of absence of mechanical equipments.
Mechanical Braking System:
It uses Frictional force between the rotating pars and the brake drums to produce required braking. Mechanical equipments such as brake linings, brake shoes and brake drums are required.
- Low efficient
- The energy of the rotating parts is wasted as heat in friction.
- Depending upon the conditions the braking may not be very smooth.
- Frequent maintenance - like adjustment of brakes, replacement of brake linings. They are prone to tear & wear.
At high speed, braking torque is very less so mechanical brakes are applied to slow down the vehicle. At constant torque region the regenerative braking system comes in and motor acts as generator and negative torque is produced to charge battery.
3. Make a MATLAB program which plots contour of given motor speed, torque and efficiency values. Attach the code as a .m file attach a screenshot of all the plots.
Solution:
The efficiency Map of the electic motor consist of a contour plot of torque Vs Speed. It gives information of the efficiency range at a different combination of speed and torque. It is necessary to consider the Iron, Copper, Windage and constant motor losses.
MATLAB CODE
close all
clear all
clc
%% Input
x= linspace(1,1000); % Motor speed in rad/s
y= linspace(1,250); % Motor Torque in Nm

% constant
Kc=0.2; % Copper Loss
Ki=0.008; % Iron loss
Kw=0.00001;% Windage loss
Constl=20; % Constant motor loss

% 3D array
[X,Y]= meshgrid(x,y);
output_power=(X.*Y); % Element mult for Power
Copperloss= (Y.^2)*Kc; % cu loss eqn
Ironloss=X*Ki;
Windageloss=(X.^3)*Kw;
% Efficiency
Input_power=output_power + Copperloss + Ironloss + Windageloss + Constl;
Z=output_power./Input_power;
V=[0.75,0.8,0.85,0.9,0.91,0.92,0.93];

%%Plot
contour(X,Y,Z,V);
xlabel('speed in rad/s');
ylabel('Torque in Nm');
legend('0.75,0.8,0.85,0.9,0.91,0.92,0.93');
hold on;
Plot
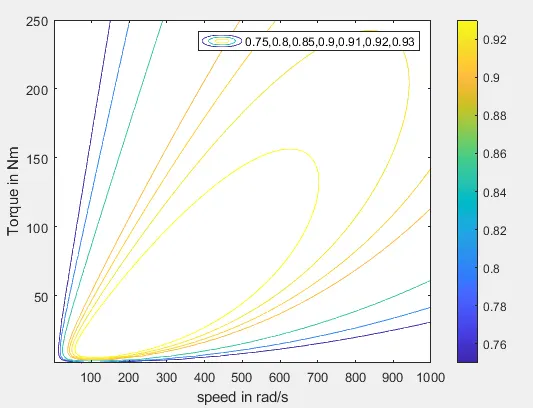
Inference: It is envisaged from the plot that the 2-D array of the Speed and torque are defined as 3D Array using the mesh grid command. Plot has efficincy range from 0.75 to 0.93. The following inferences are obtained:
- Speed and Torque varies with increase in efficiency due to motor losses
- 75% contour efficiency is observed on the dark blue line. Torque reaches a peak value of 250 Nm having velocity low. As torqe increases speed decreaes for the same efficiency.
- 93 % contour efficiency is observed on the bright yellow line where the Speed Vs Torque values are lower compared to 75% efficiency contour.
- For High Efficiency lower speed - Torque combination is required to overcome motor losses.