Week-11 Challenge: Braking
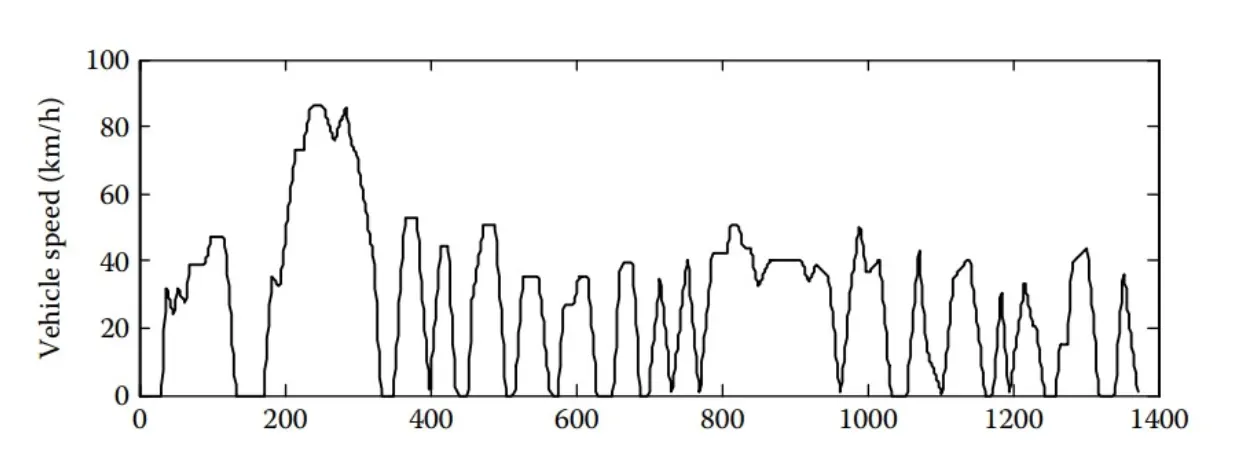
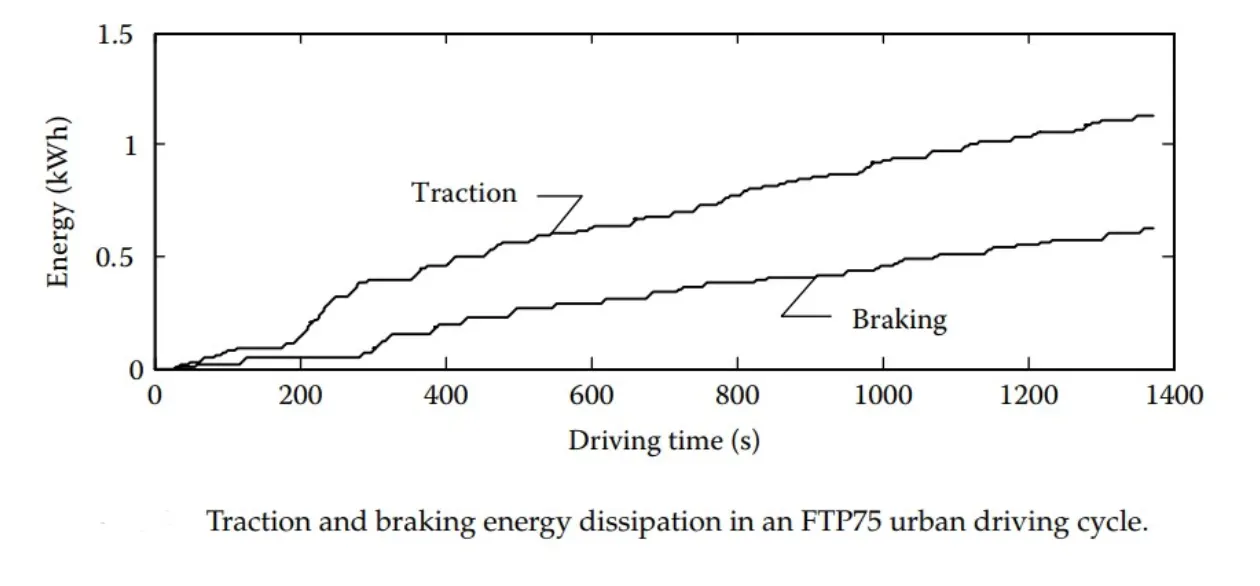
When the vehicle gets braked, for a given driving cycle, the kinetic energy of the vehicle gets converted into heat energy via friction. The tractive force mainly comprises of inertia force of the vehicle due to its weight, rolling resistance force and drag force. Out of these three, drag and inertial forces play prominent role in braking. During braking, the direction in which the vehicle is getting accelerated has to be reversed.
To calculate the braking power required in KW-h, Excel spreadsheet is used and an attachment is provided below.
https://drive.google.com/file/d/12vAxTIiOpMELPoTE-bAXEbNtWxtXjLzL/view?usp=sharing
For convenience sake, the vehicle parameters are taken to be same except for the final initial velocities in both the cases.
Conclusion:
In the first case, the deceleration rate is 2.78m/s^2 and in the second case, it is 2.222m/s^2 and the corresponding Braking powers are 0.016 and 0.010 KW-h
It is clear that as the deceleration rate climbs up, the power required to bring the vehicle to stop also skyrockets with a parabolic relationship (P = 0.5* m* (vi-vf)^2/(t*3600*1000)) KW-h).
2. To answer this question, let us consider the operating regions of an EV:
- Constant Torque region
- Constant Power region
- Constant speed region (OR reduced power region)
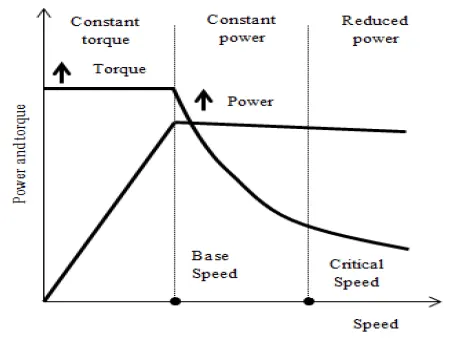
In Constant torque region the vehicle will be running at low speed and as the vehicle hits the base speed, it steps into constant power mode where the torque drops and speed increases exponentially. This increase in speed makes it difficult stall the vehicle even with all the brake power available.
But during starting, higher speeds can be easily achieved from the rest.
In simple words, the peak acceleration during starting soars slightly higher than the peak deceleration during braking due to the fact that the battery doesn’t charge (during braking) at the same rate as discharging (during acceleration).
Ergo, Rate of discharge > Rate of charging.
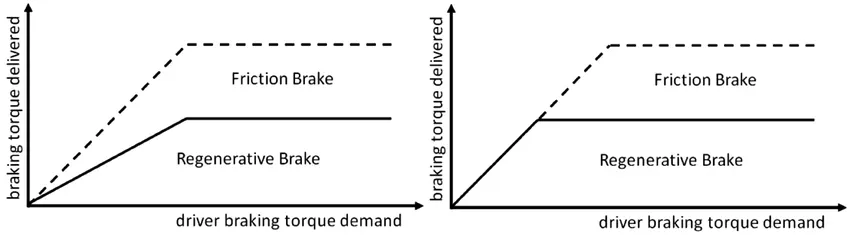
Mechanical brakes and Electrical brakes:
Synchronicity between these two brakes can be achieved in two ways:
Series braking:
Here the electrical brakes are applied first and then the mechanical brakes. This way the KERS gets activated first and converts most of the kinetic energy of the vehicle into electrical energy of the battery (regeneration).
Later the mechanical brakes are brought into action which brings the vehicle to stop effectively.
This prevents the loss of energy in the form of friction due to mechanical brakes.
Albeit the advantage, the stopping distance increases or the braking efficiency goes down.
Parallel braking;
In this case, both the brakes are applied together in tandem. This increases the braking efficiency compared to series braking but the KERS efficiency falls.
3. Matlab code for generating a contour of torque, speed efficiency. The loss parameters considered are :
Copper loss (T^2*Kc)
Iron loss (N*Ki)
Windage loss (N^3*Kw)
Consatnt losses
close all
clear all
clc

Torque = linspace(1,250);      % in N-m
Speed  = linspace(1,1000);       % in RPM

%various motor losses
Kc = 0.25;     %Copper loss constant
Ki = 0.012;    %Iron loss consatnt
Kw = 0.00008;  %Windage losses

C = 27;   %motor consatnt loss

%creating a 2-D array of torque and speed
[N,T] = meshgrid(Speed, Torque);

%Output and input power calculation
Pout = N.*T;
Pin = Pout + Kc*(T.^2) + Ki*N + Kw*(N.^3) + C;
Eff = Pout./Pin;

%using a wide range of efficiencies to generate contour surface
V = [0.5:0.05:0.95];

%generating contours
box off
contourf(N,T,Eff,V)
colorbar
title('Efficiency variation with torque and speed')
xlabel('Torque in N-m')
ylabel('speed in rpm')
Resultant contour:
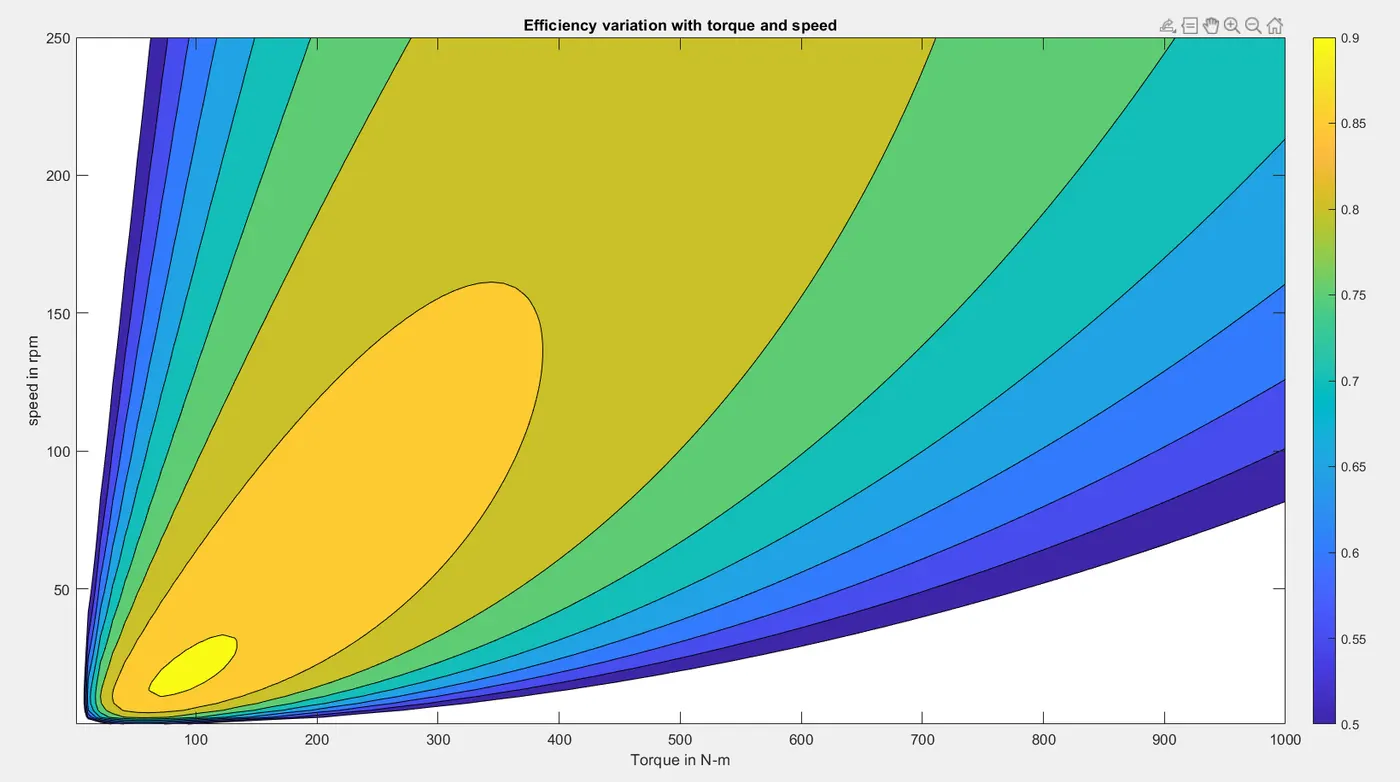
Conclusion:
It can be clearly seen from the contours that the efficiecny is high for lower values of torque and speeed. This tells us that an inverse relationship exist between outpower and the efficiency of a the motor