Week-11 Challenge: Braking
1. For a defined driving cycle, calculate the energy required for braking.
A driving cycle is a series of data points representing the speed of a vehicle versus time.
Driving cycles are produced by different countries and organizations to assess the performance of vehicles in various ways, as for instance fuel consumption, electric vehicle autonomy and polluting emissions.
Fuel consumption and emission tests are performed on chassis dynamometers. Tailpipe emissions are collected and measured to indicate the performance of the vehicle.
Another use for driving cycles is in vehicle simulations. More specifically, they are used in propulsion system simulations to predict the performance of internal combustion engines, transmissions, electric drive systems, batteries, fuel cell systems, and similar components.
Some driving cycles are derived theoretically, as it is preferred in the European Union, whereas others are direct measurements of a driving pattern deemed representative.
There are two types of driving cycles:
- Transient driving cycles involve many changes, representing the constant speed changes typical of on-road driving.
- Modal driving cycles involve protracted periods at constant speeds
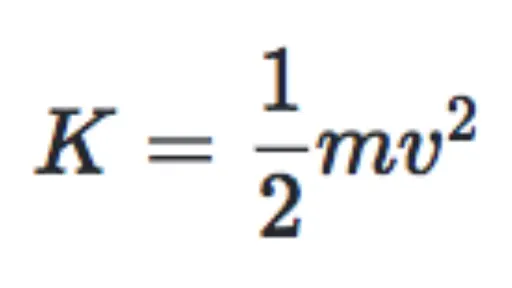
Kinetic Energy:-
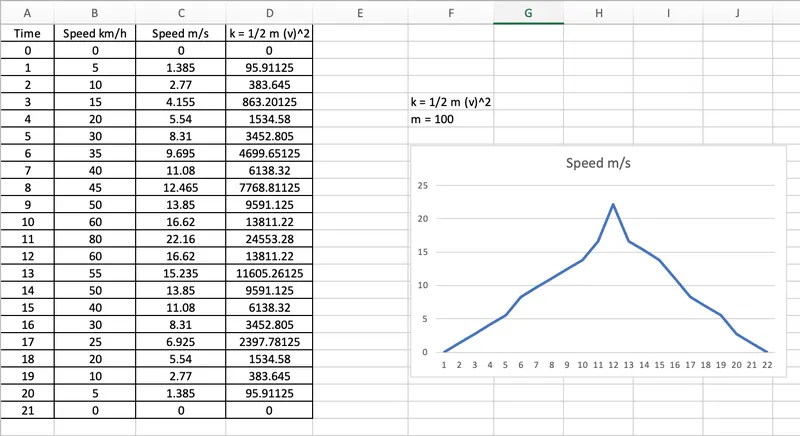
Braking Energy

2. Why electric motor can’t develop braking torque at a high speed similar to starting? How electric and mechanical brakes are coordinated?
Reasons why the torque actual is NOT the real torque:
- If commutation, phasing, is not correct, an important part of the current is not useful torque, it just creates electrical and magnetic loses.
- If current loop is not well configured or unstable, the current will be higher and with ripple, the real "useful mechanical torque" will be indeed lower.
- Torque constant can vary due to several factors, like motor construction, the temperature of the magnets (that affects its magnetic properties).
However, this solution is a good and practical approximation. And saves expensive torque meters or strain gauges.
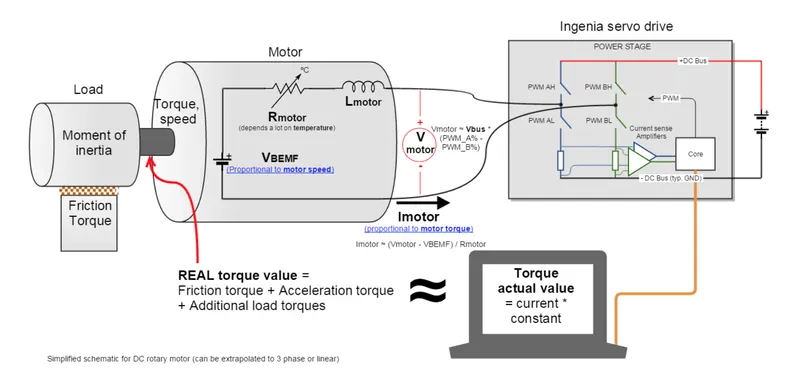
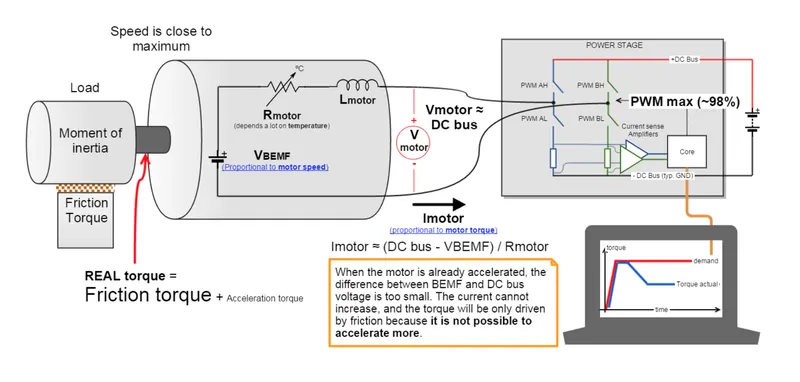
Sometimes after accelerating you can't reach the maximum torque. The reason is that no matter how much the current loop wants to increase current (proportional to torque) by increasing the PWM duty cycle of the power stage, the V motor is too close to Vbemf and therefore current can't increase more.
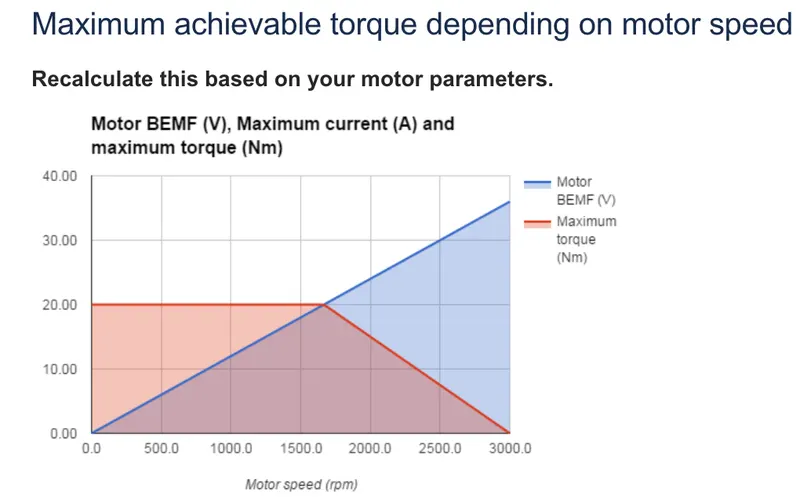
Whenever Friction torque + Additional loads = Motor Torque, the load remain in equilibrium (does not move, or moves under constant speed). Whenever Friction torque + Additional loads < Motor Torque, the load accelerates (Motor torque - Friction torque - Additional loads = Acceleration torque > 0). Al high speeds, the BEMF is so close to Vbus that the applicable Motor torque gets limited. Then, the bigger the Friction torque + Additional load is, the smaller the Acceleration torque becomes.
This can also occur if acceleration or speed is limited for some reason.
This situation does not occur at the beginning of acceleration because most of the torque is used to increase the kinetical energy of the load (and motor). But when the speed is already high and no extra load is applied it is not possible to increase the torque.
Prevention:-
Increase DC bus voltage.
Unlimited system acceleration.
Use a motor with less resistance and lower back EMF proportion.
Comparison for electric mobility throttles:-
This situation creates a bad feeling that at high speeds the throttle does not work correctly.
The user feels that it releasing the throttle does not reduce motor force!
The proposed solution is to add a torque demand limitation based on speed.
- Will improve user feeling when releasing brake when the vehicle is already accelerated.
- Will limit vehicle top speed (safety)
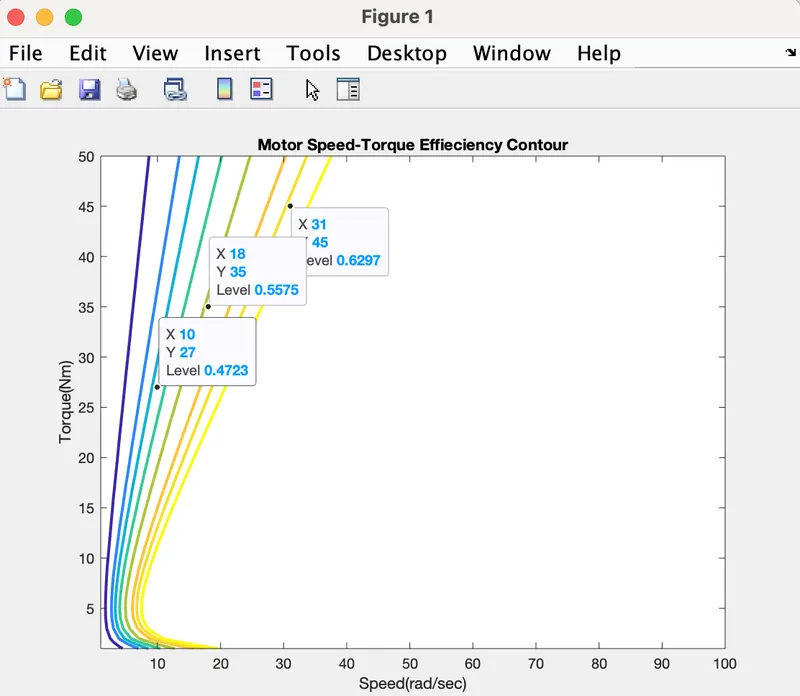
3. Make a MATLAB program that plots the contour of given motor speed, torque and efficiency values.
%inputs
Speed = linspace(1,100,100);
Torque = linspace(1,50,50);

%losses
cl=0.4; %for copper losses
il=0.002; %for iron losses
wl=0.00001; %for windage losses
C=10; %for constant motor loss

%meshing
[S,T]=meshgrid(Speed,Torque);

%calculating power = speed * torque
Power_output = (S.*T);

%calculating losses
ccl=(T.^2)*cl %copper losses
cil=S*il %iron losses
cWl=(S.^3)*wl   %windage losses

Power_input = Power_output+ccl+cil+cWl+C;
Effieciency = Power_output./Power_input;

%effieciency to plot contour
E=[0.30,0.40,0.45,0.50,0.55,0.60,0.625,0.65];
box off
grid off
contour(S,T,Effieciency,E,'linewidth',2)
xlabel('Speed(rad/sec)')
ylabel('Torque(Nm)')
title('Motor Speed-Torque Effieciency Contour')
hold on
Graph:-