Week-11 Challenge: Braking
1. For a defined driving cycle, calculate the energy required for braking.
A. Braking energy is the energy required for to bring a vehicle to rest from a given velocity. It depends on the mass and the instantaneous velocity of the vehicle.
To calculate Braking energy, we will
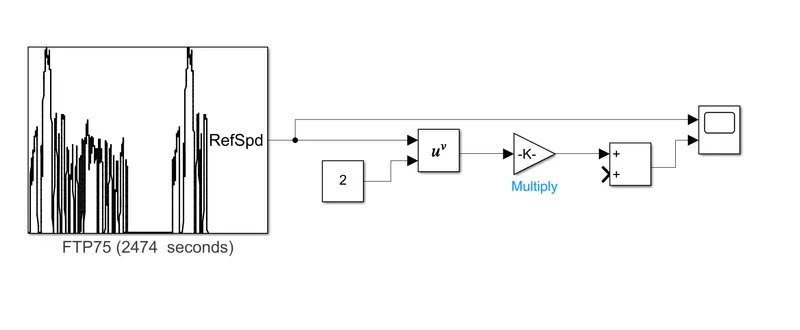
We will assume suitable values of above vehicle parameters and calculate the braking energy in Simulink.
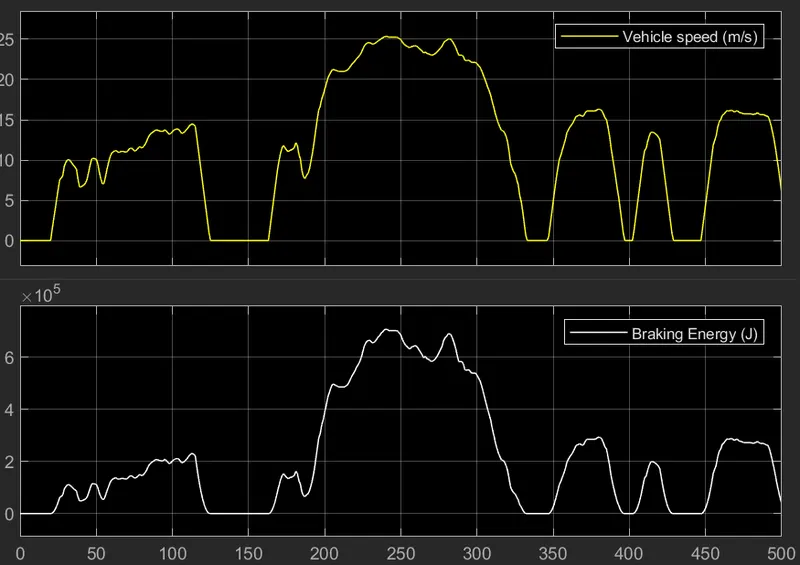
We will use a FTP75 drive cycle and run the simulation for 500s.
Output:
2. Why electric motor can’t develop braking torque at high speed similar to starting? How electric and mechanical brakes are coordinated?
A. An Electric motor generates Torque at a given value of rotor speed. This torque - speed relationship is a defined curve for both induction and DC motors. The torque-speed characteristics of both types of motor is shown below:
DC motor:
Induction motor:
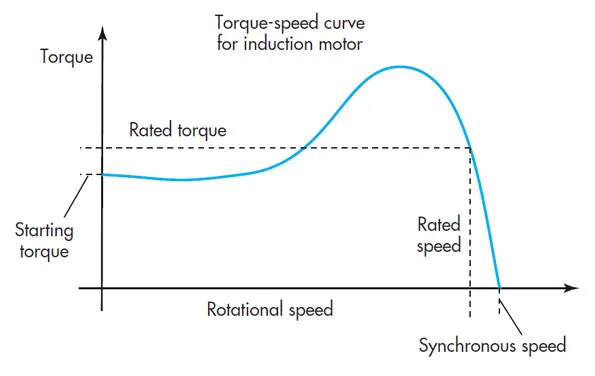
From above curves its evident that the motor supplies lower torque at higher speed. Hence The braking torque at high speeds is much lower than the starting torque.
For braking, most EVs apply two methods: Electrical Braking and Mechanical Braking
Electrical Braking:
This method consists of using the motor to brake, by applying an opposing torque. This is achieved in following ways:
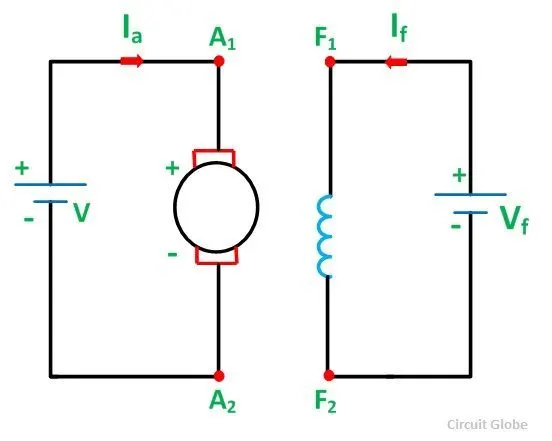
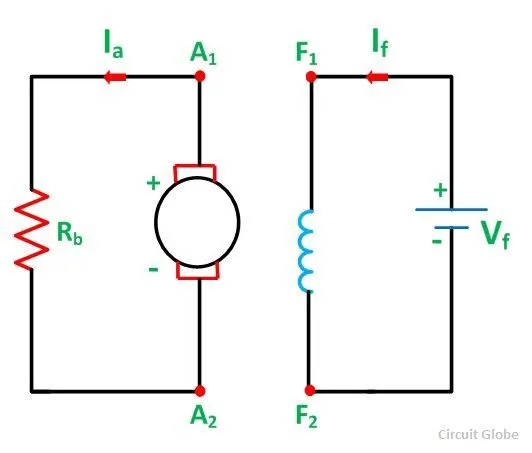
1. Dynamic Braking: In this method, a braking resistor is used to control the current to the armature and hence reduce the pwer output of the motor. This is a non-regenerative braking method, and is very inefficient as the power is not throttled, but dissipated in the form of heat.
The battery supply is disconnected and the resistor is connected in series with the motor, when the braking is taking place. Thus the motor works as a generator and dissipates heat through the resistor.
Normal Operation:
Braking mode:
Terminal Voltage reversal:
In this method, The armature voltage is reversed in polarity by means of a switching circuit, when braking is desired.
This generates a very high opposing torque and is an extreme form of braking.
This is generally used in combination with a braking resistor, to avoid the extreme braking torque.
Phase reversal:
This is used in 3 phase induction motor applications. Any one of the 3 phases are reversed, which leads to a high opposing torque, similar to the Terminal Voltage reversal method.
Single Phasing:
One of the three phases is cut off, and the motor operates in one phase, leading to lower torque and power output.
Mechanical Braking:
In this method, frictional force is used to physically slow down the rotation of the wheels. The frictional force is applied by means of disc brakes with frictional lining material. This method does not generate any regenerative action and hence reduces overall efficiency of the vehicle.
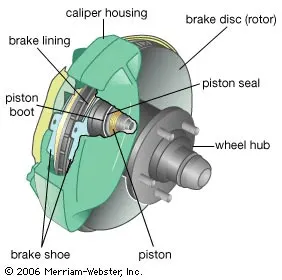
Generally, an EV employs both Electric and Mechanical Braking.
They can be applied one at a time(Series Strategy) or Simultaneously(Parallel Strategy)
3. Make a MATLAB program which plots contour of given motor speed, torque and efficiency values. Attach the code as a .m file attach a screenshot of all the plots.
A. To plot the efficiency contour of a motor, we need to calculate the power losses and the total power.
Power losses in an electric motor are Copper losses, Iron losses, windage losses, and any other losses not covered.
These losses can be represented as:
Copper losses = kc*`T^2`
Iron losses = ki*`omega`
Windage losses = kw*`omega^3`
Code:
%Program to plot contour plots of efficiency of motor, against the
%speed and torque

close all;
clear all;
clc;

%Inputs and assumptions
kc = 0.2;
ki = 0.005;
kw = 0.00001;
c = 20;

%generating X-Y co-ordinate space
x = linspace(0,628,500); %Speed axis, assuming Speed upto 628 rad/s
y = linspace(0,1000,500); %Torque axis, assuming torque upto 4000 Nm

[X,Y] = meshgrid(x,y);

%Calculating Power loss L
L = kc.*X.^2 + ki.*Y.^2 + kw.*Y.^3 + c;

%Calculating total power
P = X.*Y;

%Efficiency Z = (Total power - Losses)/Total Power
Z = (P - L)./P;

%efficiency ranges
V = [0.8, 0.85, 0.9, 0.91, 0.92, 0.925, 0.93, 0.95];
contour(X,Y,Z,V, 'showtext', 'on');
xlabel('Torque, N-m');
ylabel('Speed, rad/s');
After the inputs and assumptions are specified, we calculate the total losses by above equations.
An X-Y co-ordinate plane of Speed and Torque values is generated using Meshgrid command
The efficiency is calculated as the ratio of net Usable power to the total power
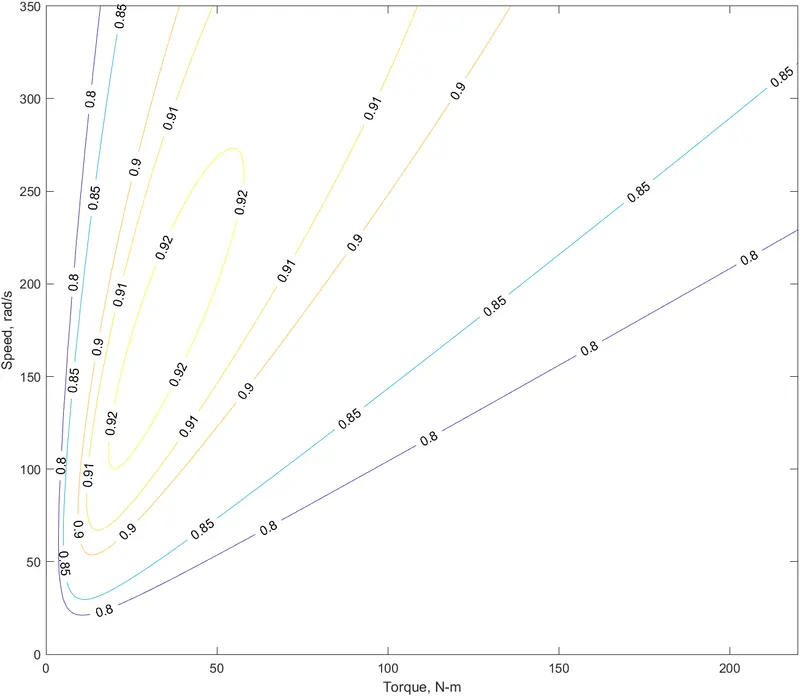
Efficiency range is specified as the vector V. These ranges will be used to plot the efficiency contour.
Output:
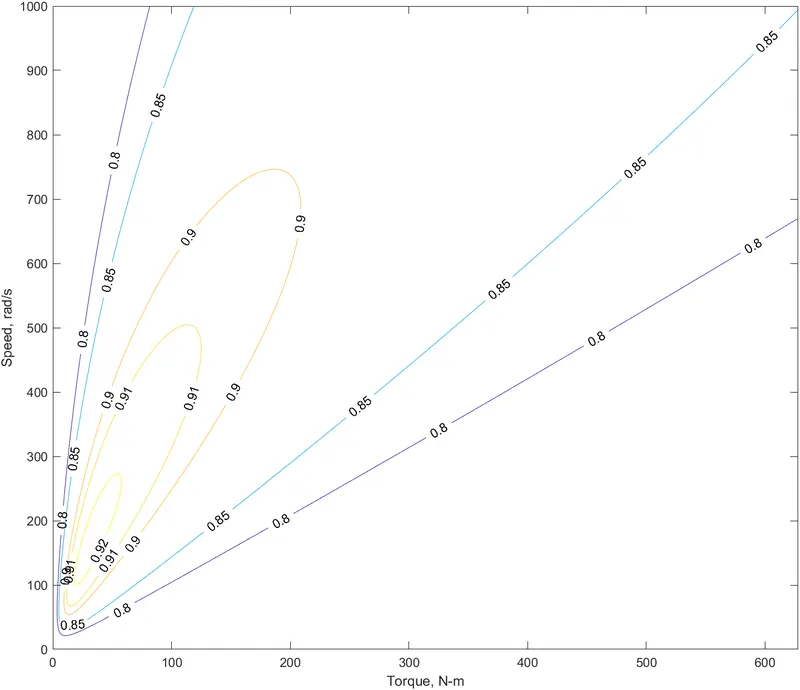
A zoomed in view of the plot: