Week 10 - Simulating Combustion of Natural Gas.
COMBUSTION OF NATURAL GAS
1. OBJECTIVE
Case 1: To simulate the combustor model, plot the variation of mass fraction of different species in the simulation at given locations, and to plot the emissions of CO2, H2O, CH4, N2, O2, NOx, and soot formations.
Case 2: To simulate the combustor model by varying the water content in fuel from 5% to 30% by mole and observe its effect in the results.
2. 2D MODEL
The 2-D axis-symmetric combustor model is obtained by splitting up the given geometry.
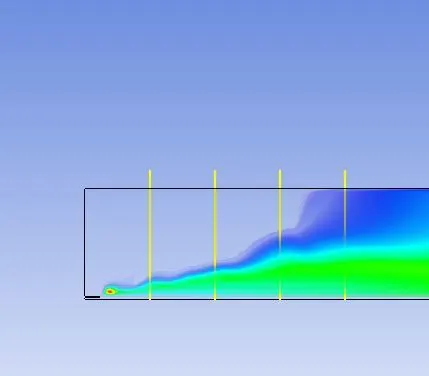
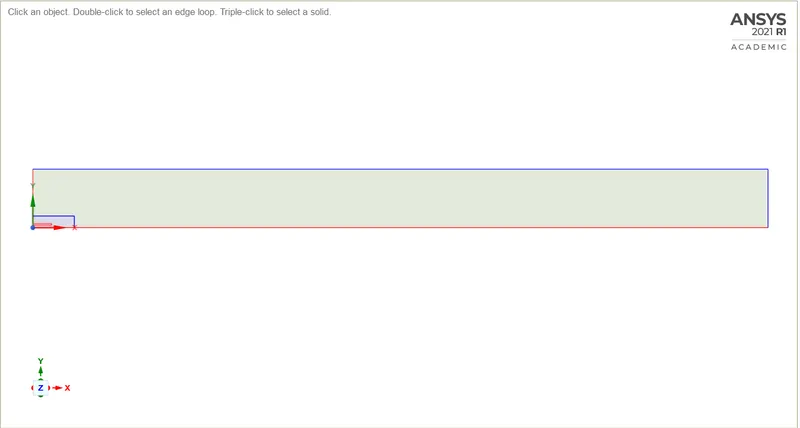
Fig.2.1. 2-D Axis-Symmetric Combustor Model
3. MESH DETAILS
The mesh metrics were confined to the limitations of the Ansys Student/Academic version.
able 3.1: Mesh Details
| METRICS | VALUE |
| ELEMENT SIZE | 7.5e-4 m |
| NODES | 0799 |
| ELEMENTS | 30112 |
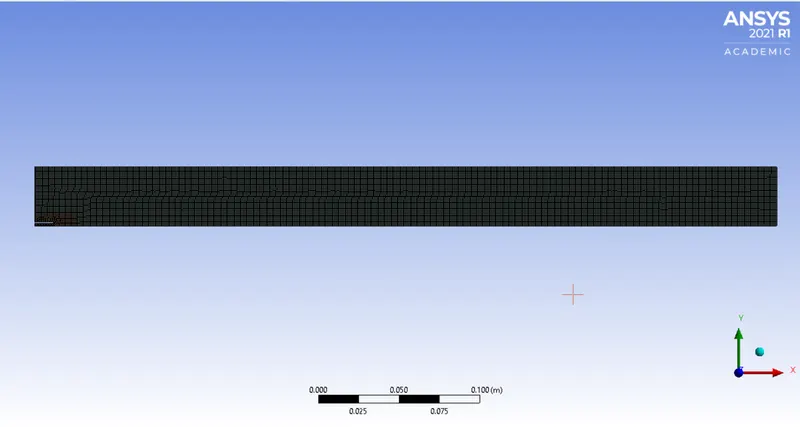
Fig.3.1. Combustor Model - Mesh
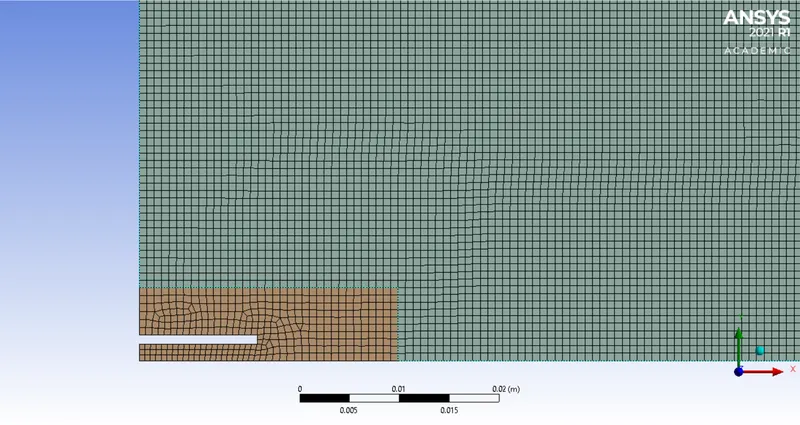
Fig.3.2. Combustor Model - Mesh Near Fuel Inlet
| METRICS | VALUE |
| MODEL | SPECIES TRANSPORT |
| REACTIONS | VOLUMETRIC |
| MIXTURE MATERIAL | METHANE-AIR-2STEP |
| TURBULENCE-CHEMISTRY INTERACTION | DDY DISSIPATION |
| OPTIONS | INLET DIFFUSION; DIFFUSION ENERGY SOURCE |
Table 4.2: NOx Model
| METRIC | VALUE |
| PATHWAYS | HERMAL NOx |
| NOx RATE | NONE |
able 4.3: Soot Model
| METRIC | VALUE |
| MODEL | STEP |
| FUEL | CH4 |
| OXIDANT | O2 |
5. BOUNDARY CONDITIONS
Table 5.1: Boundary Conditions
| METRIC | VALUE |
| VISCOUS MODEL | K-EPSILON STANDARD |
| NEAR-WALL TREATMENT | STANDARD WALL FUNCTIONS |
| AIR INLET VELOCITY | 0.5 m/s |
| O2 MASS FRACTION (AIR) | 0.23 |
| FUEL INLET VELOCITY | 80 m/s |
| CH4 MASS FRACTION (FUEL) | 1 TO 0.70 |
| H2O MASS FRACTION (FUEL) | 0 TO 0.30 |
6. RESULTS
Seven line geometries are created at different distances from the inlet region. Case 1 objective deals with 0% water content in the fuel,
while Case 2 deals with the subsequent 10% increase of water content in the fuel.
able 6.1: Line Geometry
| LINES | DISTANCE (m) |
| Line 1 | 0.04 |
| Line 2 | 0.08 |
| Line 3 | 0.12 |
| Line 4 | 0.16 |
| Line 5 | 0.20 |
| Line 6 | 0.24 |
| Line 7 | 0.28 |
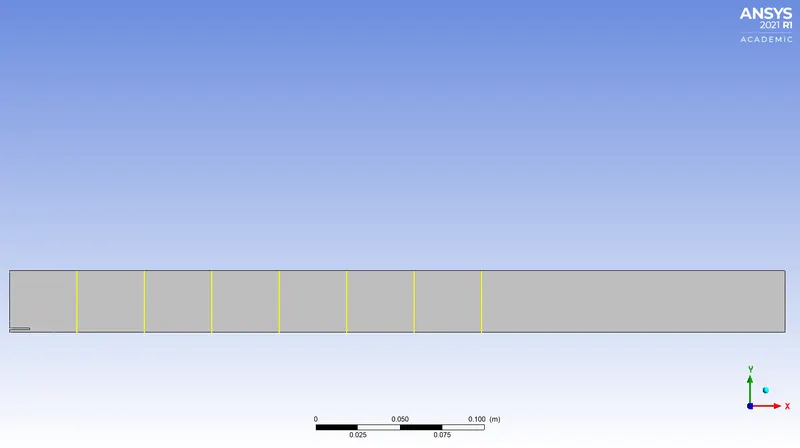
Fig.6.1. Line Geometry
6.1. 0% WATER CONTENT
6.1.1. RESIDUALS
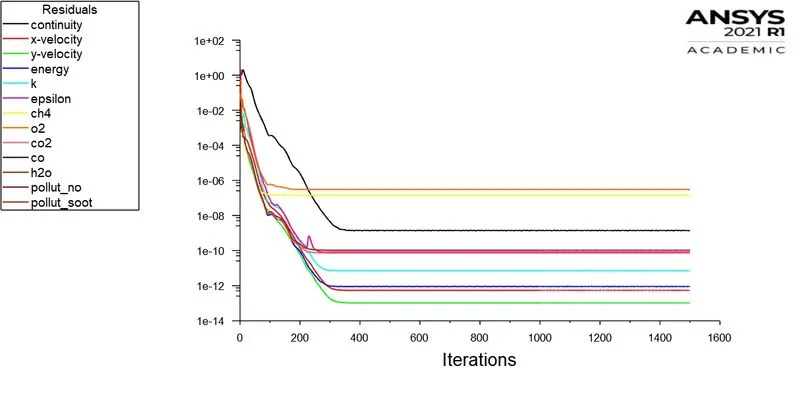
Fig.6.1.1.1. 0% Water Content - Scaled Residuals
6.1.2. TEMPERATURE CONTOUR
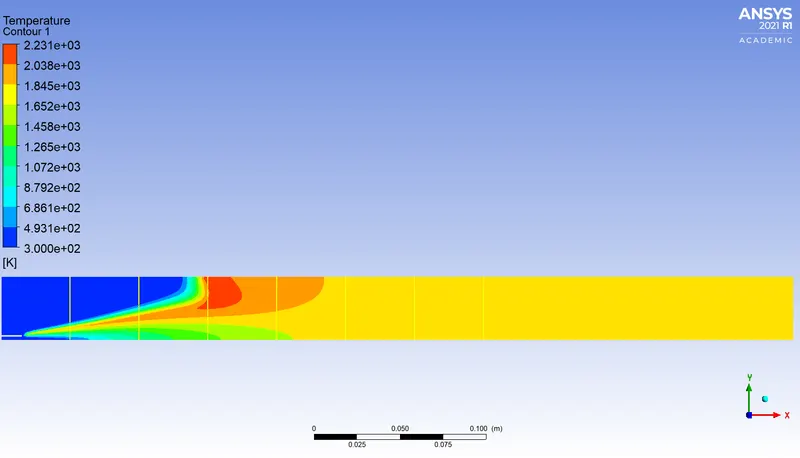
Fig.6.1.2.1. 0% Water Content - Temperature Contour
6.1.3. CH4 MASS FRACTION
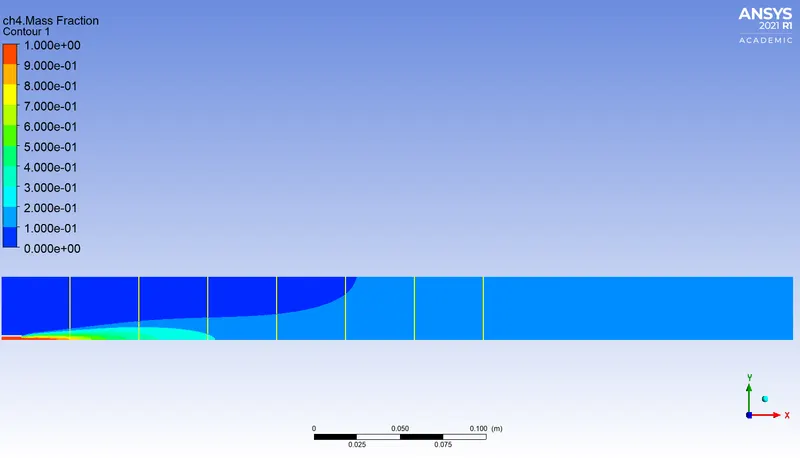
Fig.6.1.3.1. 0% Water Content - CH4 Mass Fraction Contour
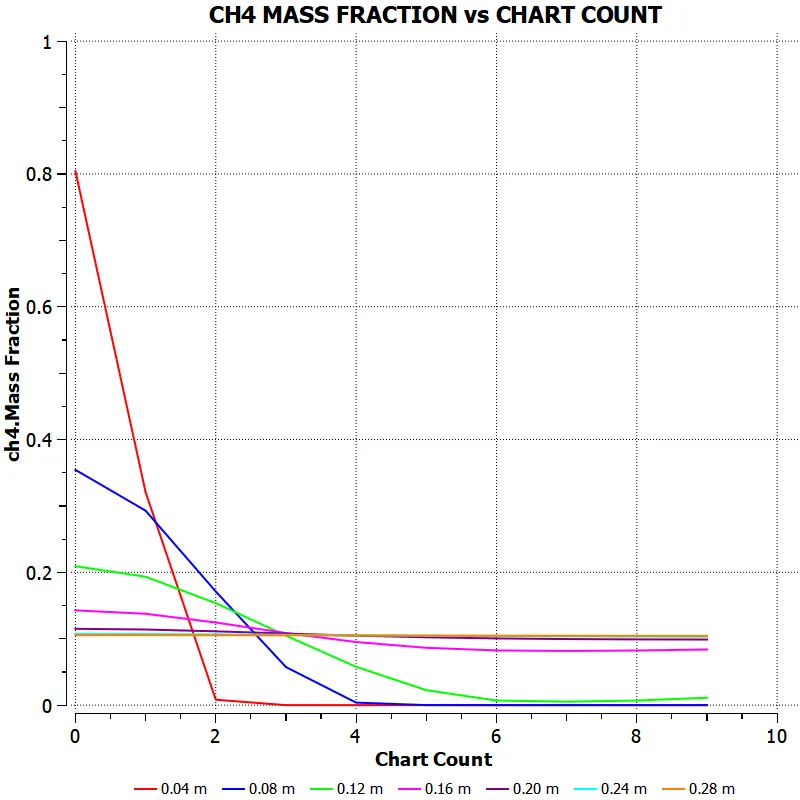
Fig.6.1.3.2. 0% Water Content - CH4 Mass Fraction Graph
6.1.4. CO MASS FRACTION
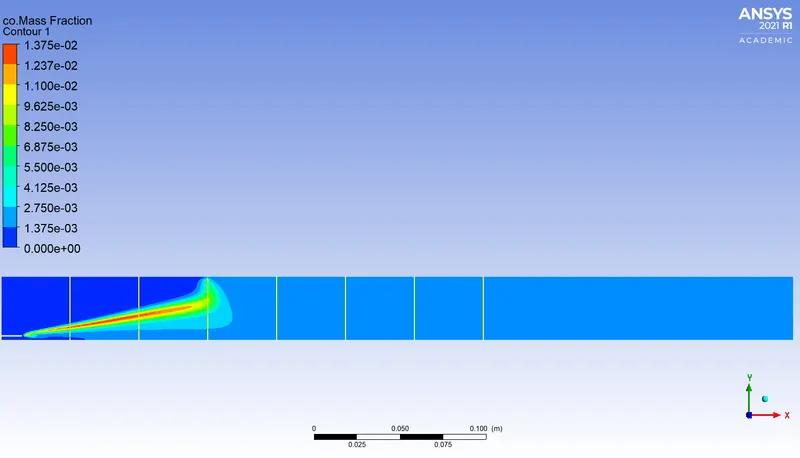
ig.6.1.4.1. 0% Water Content - CO Mass Fraction Contour
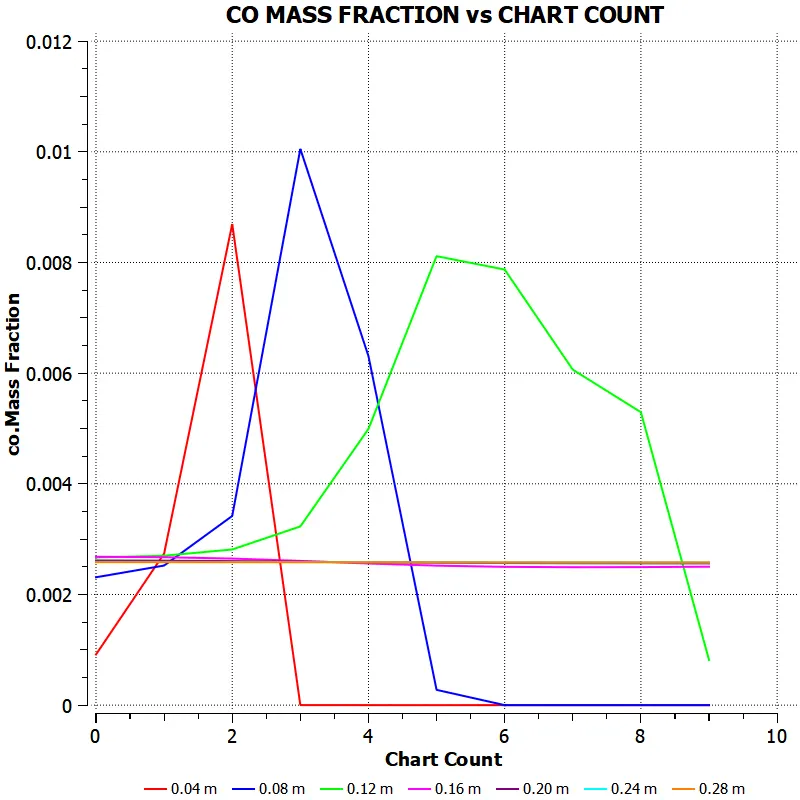
ig.6.1.4.2. 0% Water Content - CO Mass Fraction Graph
6.1.5. CO2 MASS FRACTION
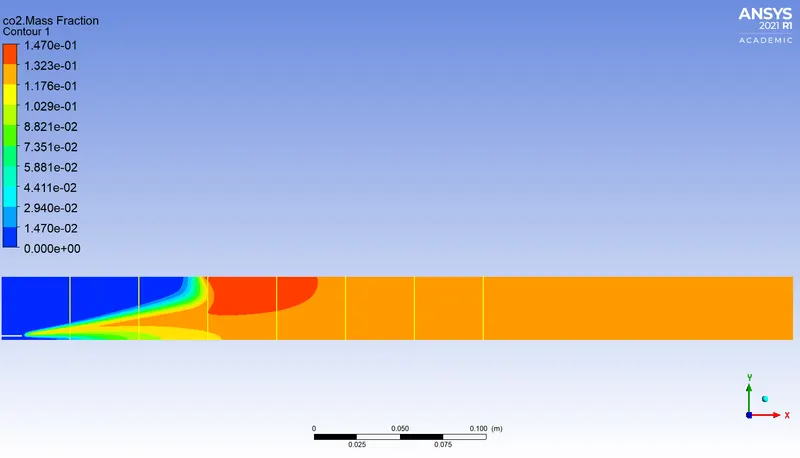
ig.6.1.5.1. 0% Water Content - CO2 Mass Fraction Contour
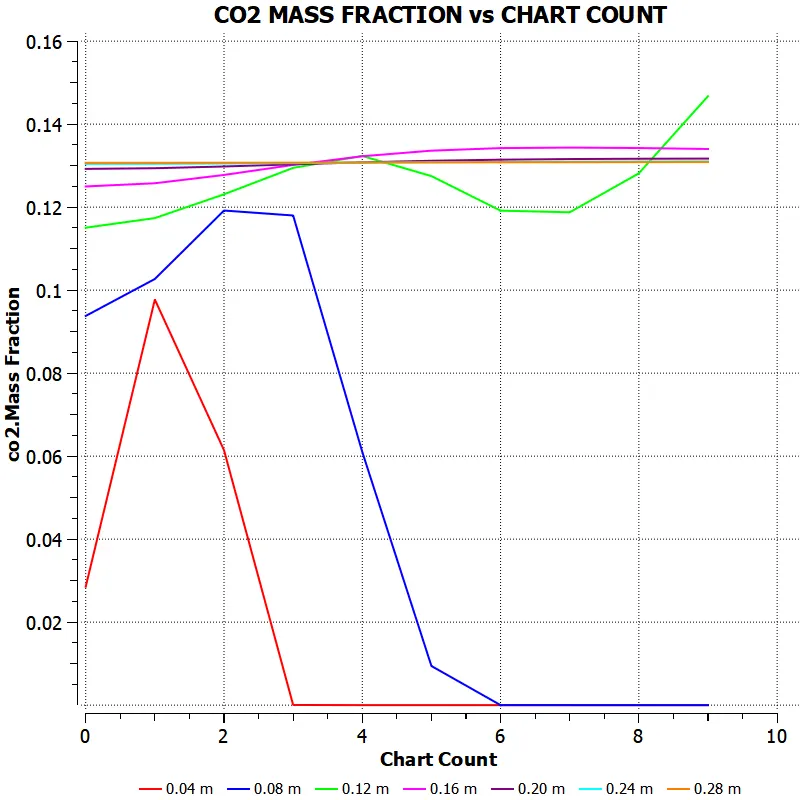
Fig.6.1.5.2. 0% Water Content - CO2 Mass Fraction Graph
6.1.6. H2O MASS FRACTION
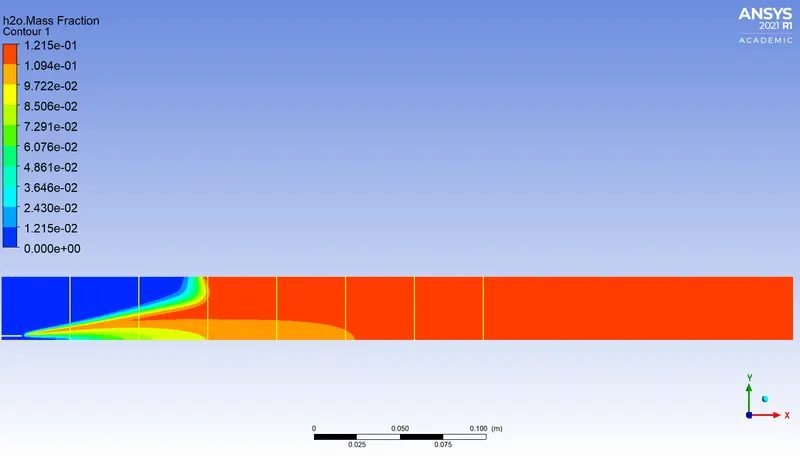
Fig.6.1.6.1. 0% Water Content - H2O Mass Fraction Contour
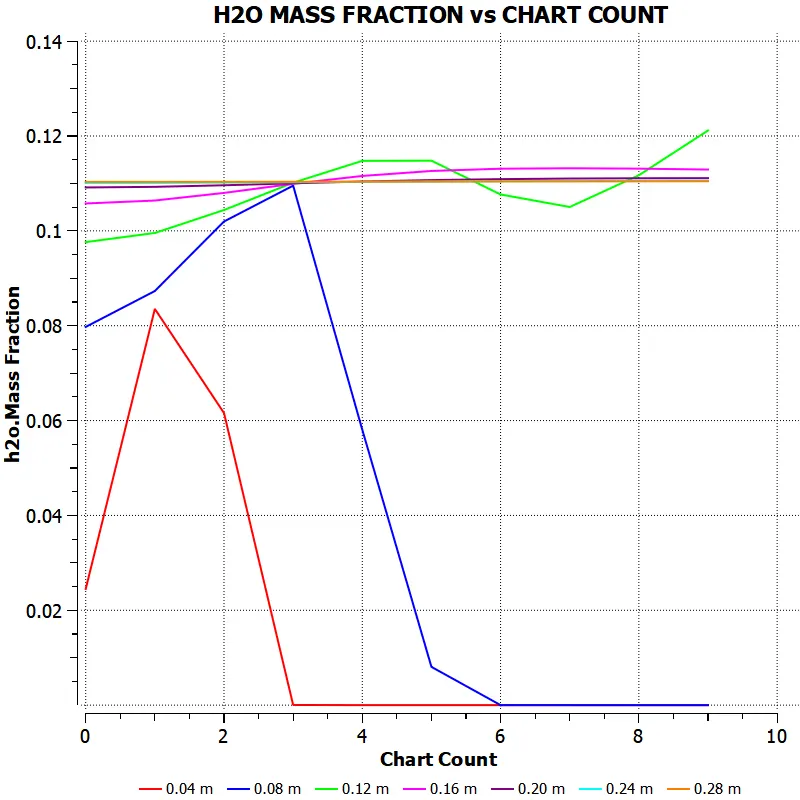
Fig.6.1.6.2. 0% Water Content - H2O Mass Fraction Graph
6.1.7. N2 MASS FRACTION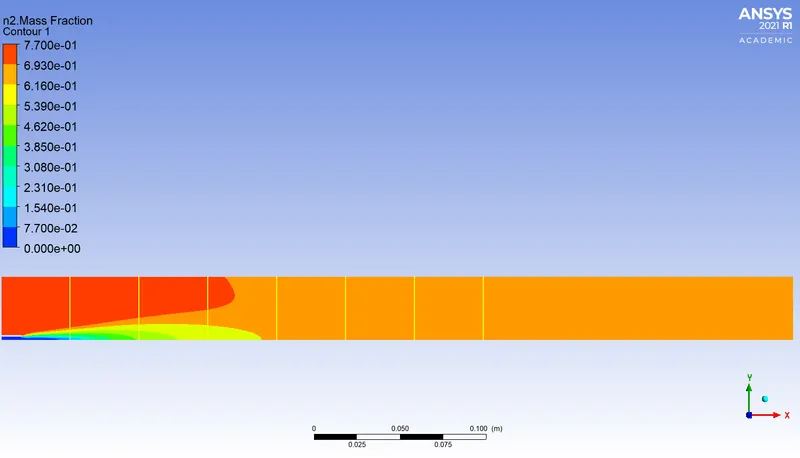
Fig.6.1.7.1. 0% Water Content - N2 Mass Fraction Contour
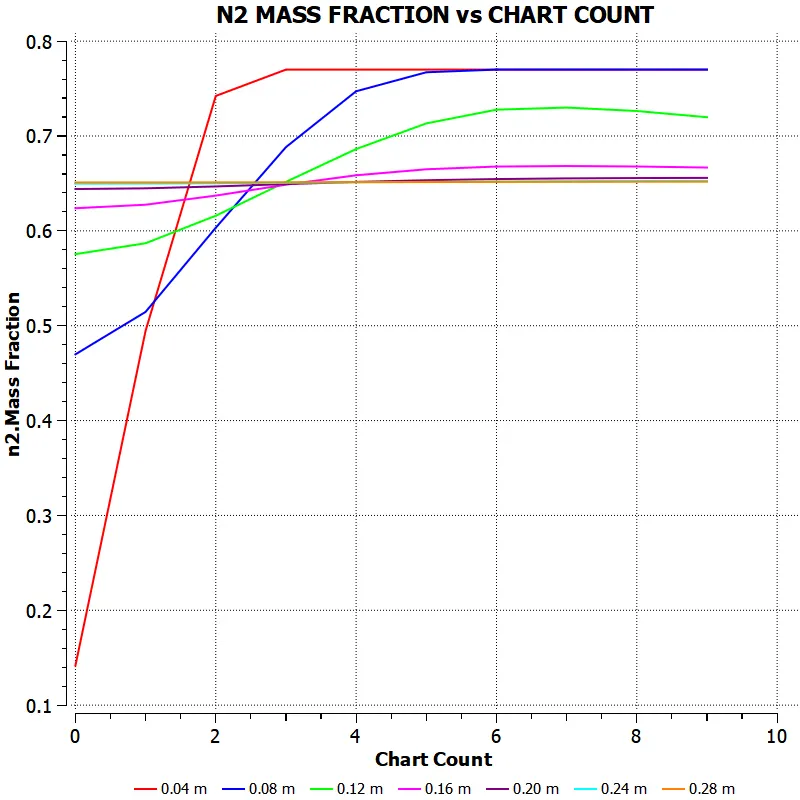
Fig.6.1.7.2. 0% Water Content - N2 Mass Fraction Graph
6.1.8. O2 MASS FRACTION
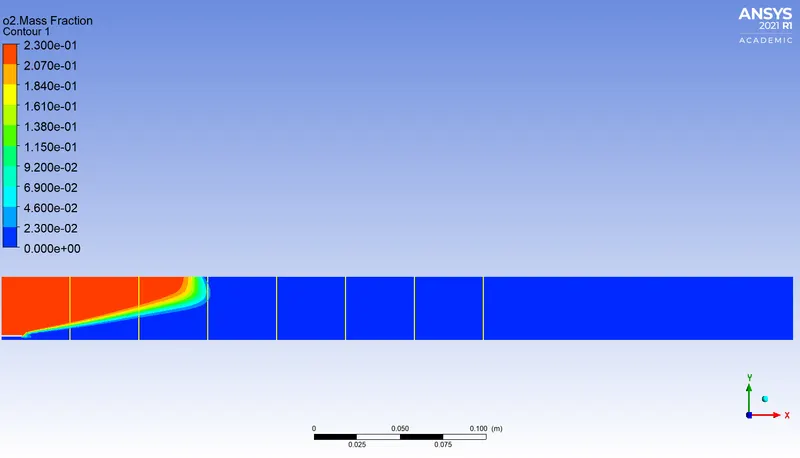
Fig.6.1.8.1. 0% Water Content - O2 Mass Fraction Contour
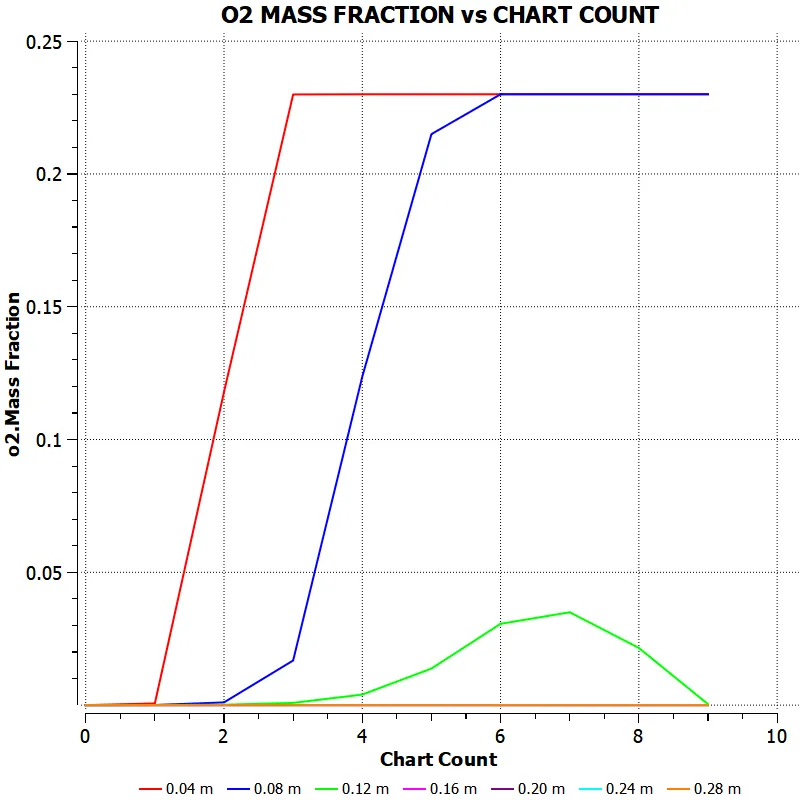
Fig.6.1.8.2. 0% Water Content - O2 Mass Fraction Graph
6.1.9. POLLUTANT NOx MASS FRACTION
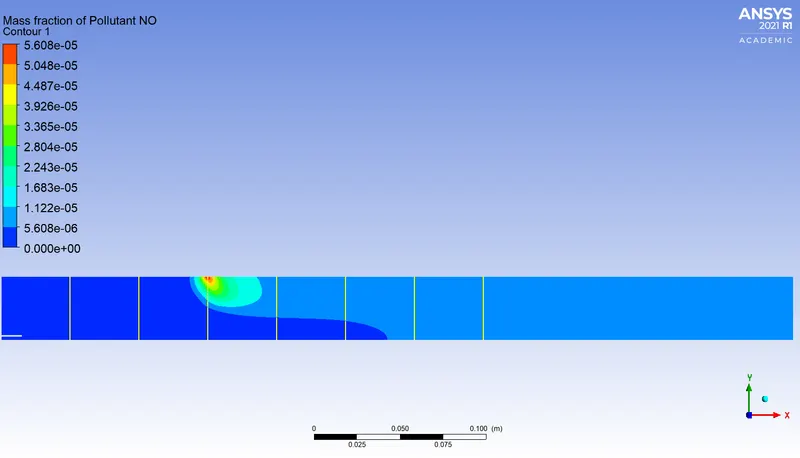
Fig.6.1.9.1. 0% Water Content - NOx Mass Fraction Contour
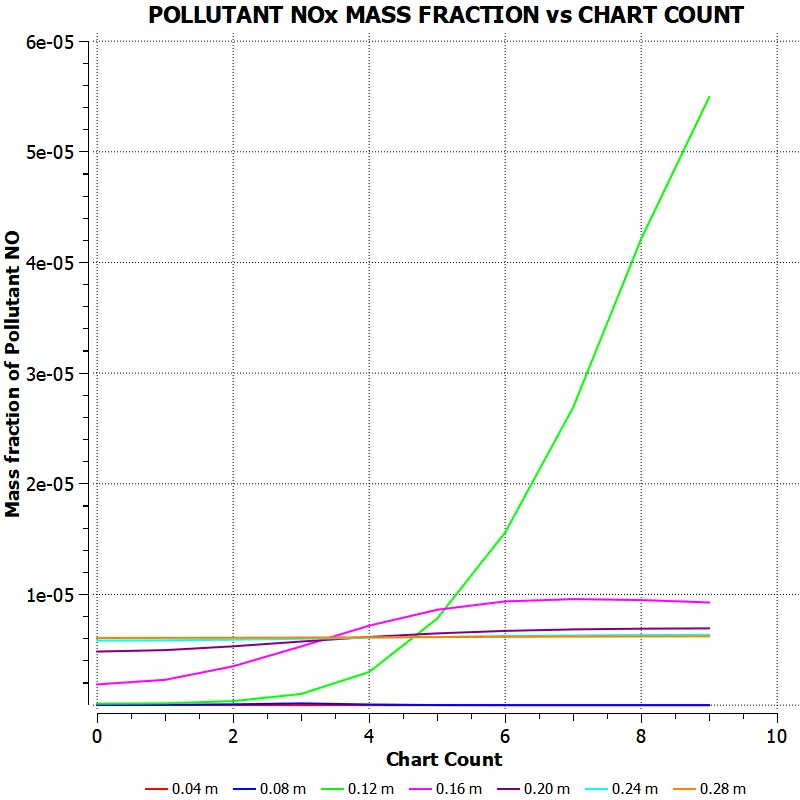
ig.6.1.9.2. 0% Water Content - NOx Mass Fraction Graph
6.1.10. SOOT MASS FRACTION
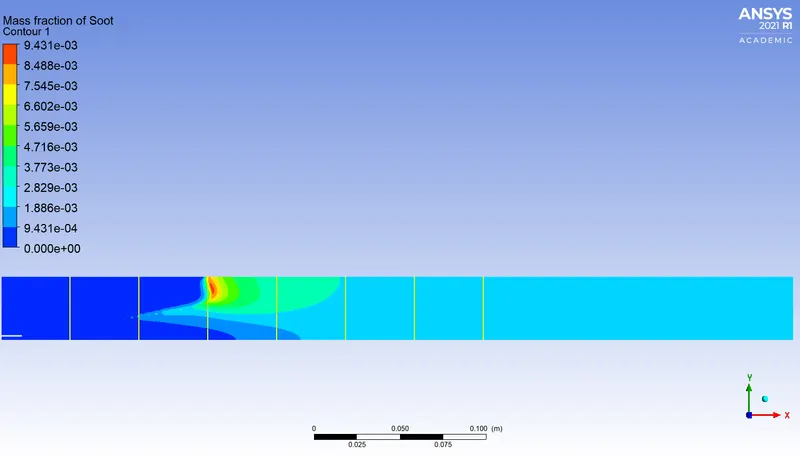
Fig.6.1.10.1. 0% Water Content - SOOT Mass Fraction Contour
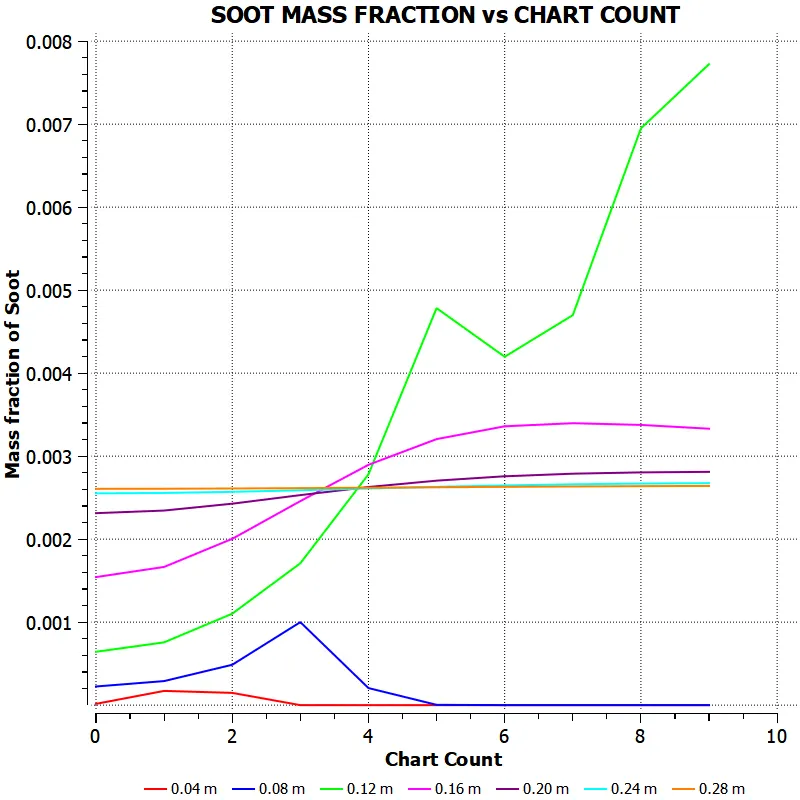
Fig.6.1.10.2. 0% Water Content - SOOT Mass Fraction Graph
6.2. CASE 2
6.2.1. RESIDUALS
The residuals tended to converge as the water content is increased, leading to a uniform values of mass fraction for different species.
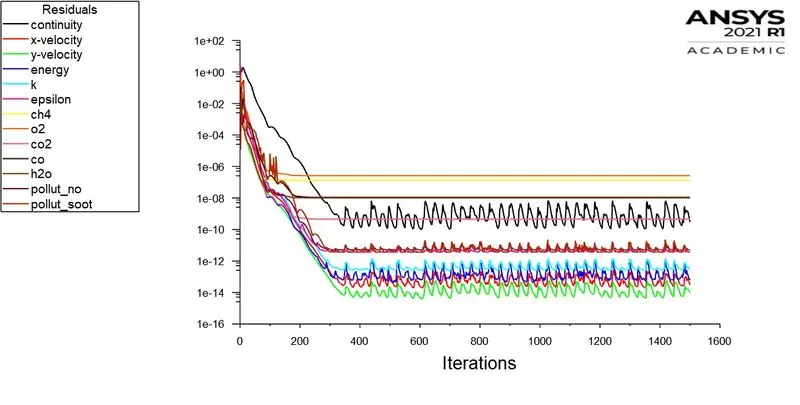
Fig.6.2.1.1. Scaled Residuals - 10% Water Content
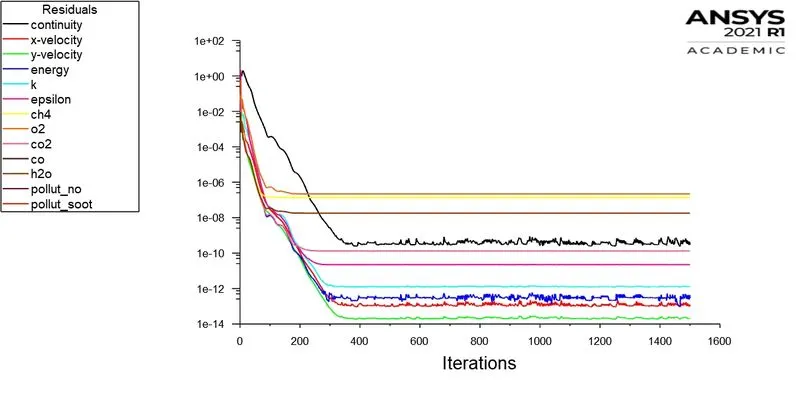
Fig.6.2.1.2. Scaled Residuals - 20% Water Content
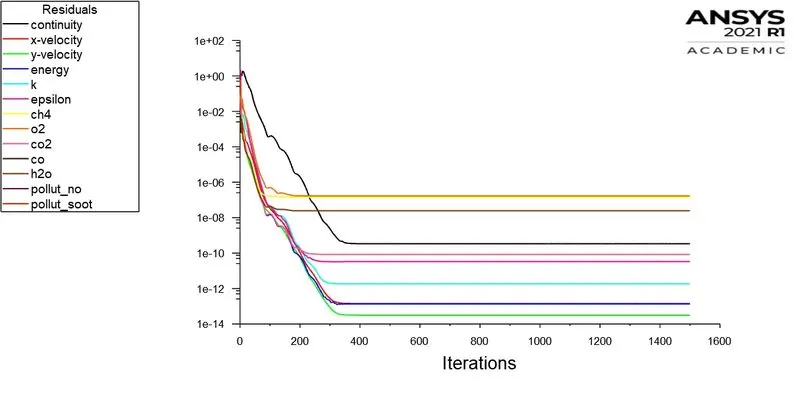
Fig.6.2.1.3. Scaled Residuals - 30% Water Content
6.2.2. TEMPERATURE
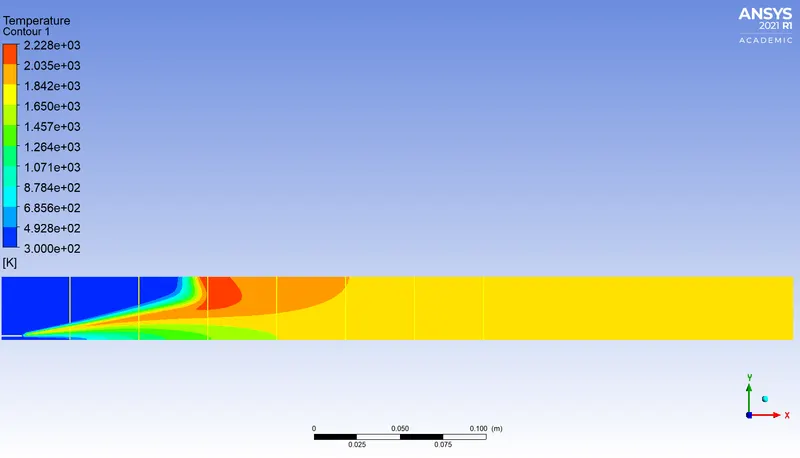
Fig.6.2.2.1. Temperature Contour - 10% Water Content
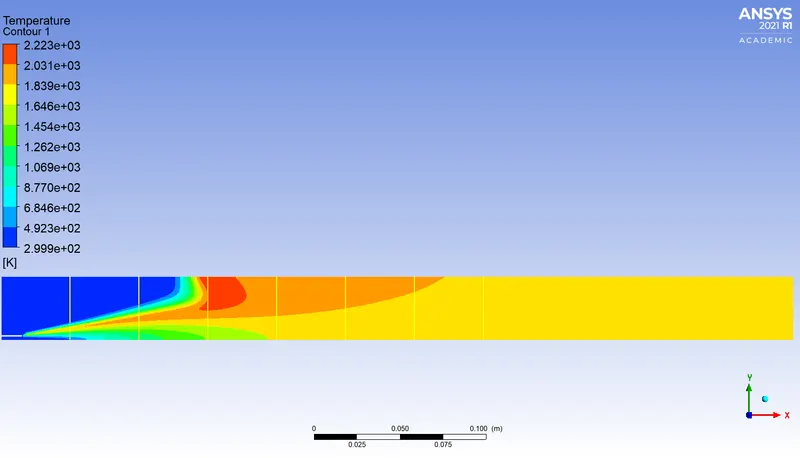
Fig.6.2.2.2. Temperature Contour - 20% Water Content
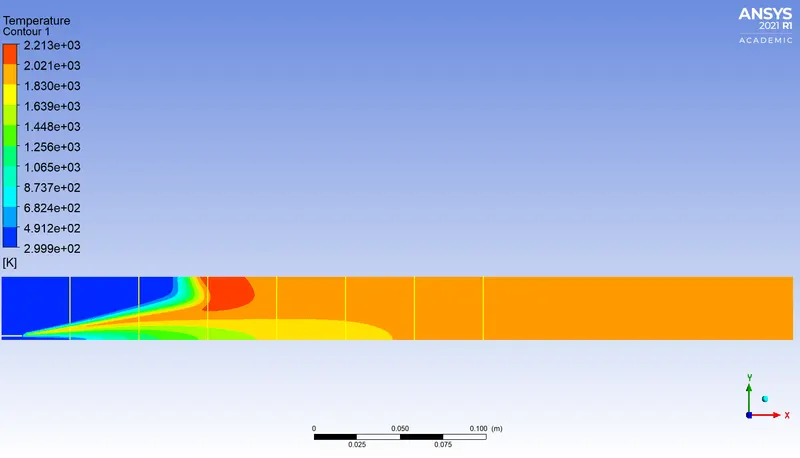
Fig.6.2.2.3. Temperature Contour - 30% Water Content
6.2.3. CH4 MASS FRACTION
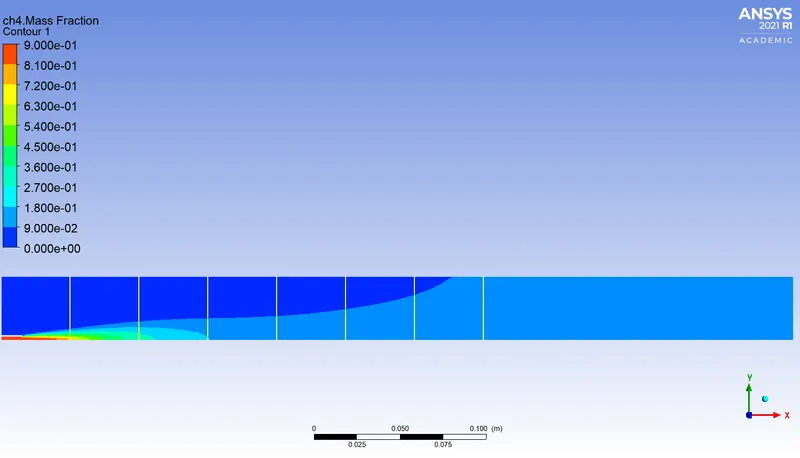
Fig.6.2.3.1. CH4 Mass Fraction - 10% Water Content
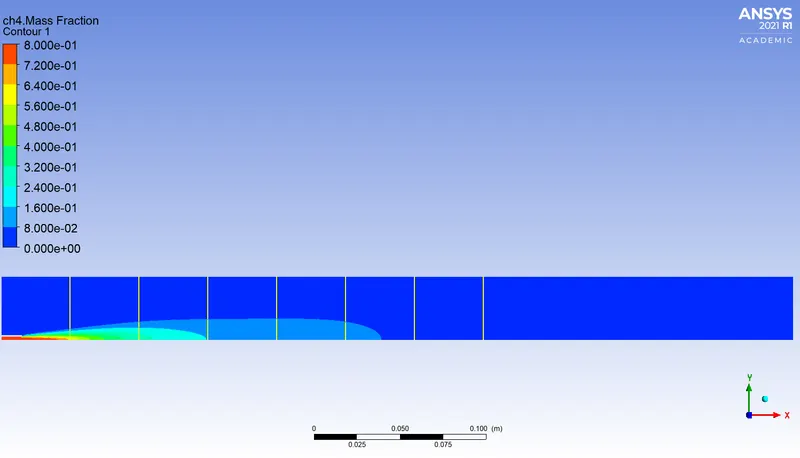
Fig.6.2.3.2. CH4 Mass Fraction - 20% Water Content
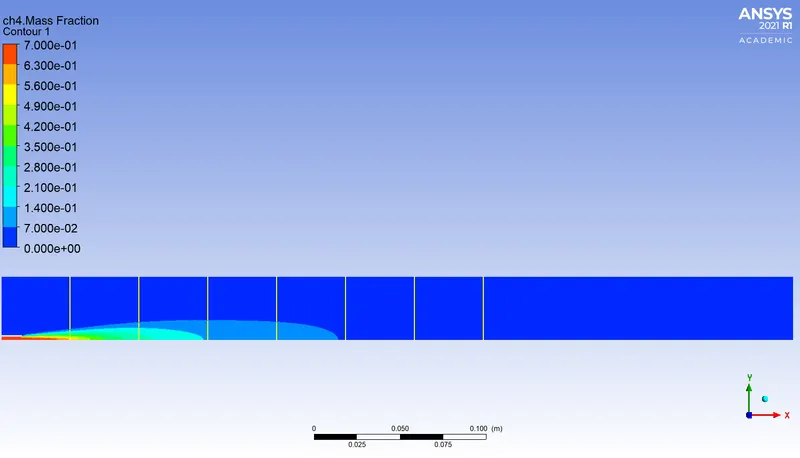
Fig.6.2.3.3. CH4 Mass Fraction - 30% Water Content
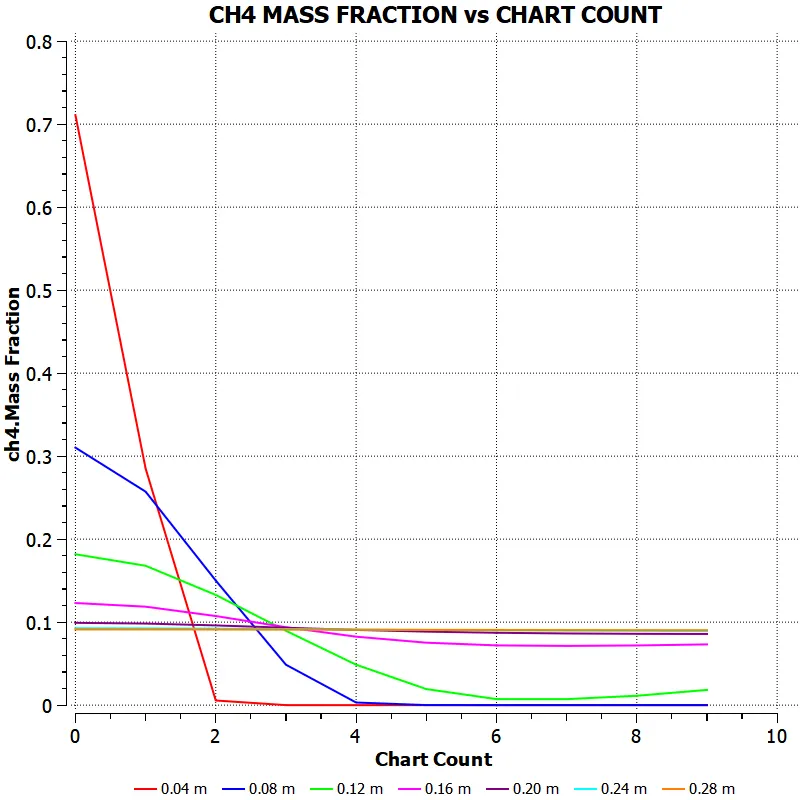
Fig.6.2.3.4. CH4 Mass Fraction Line Chart - 10% Water Content
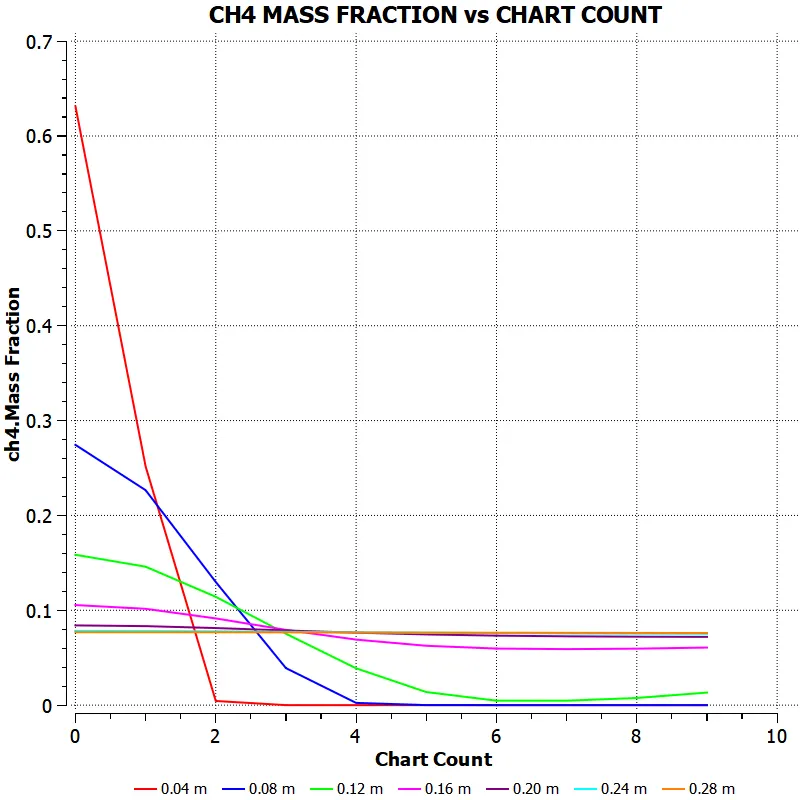
Fig.6.2.3.5. CH4 Mass Fraction Line Chart - 20% Water Content
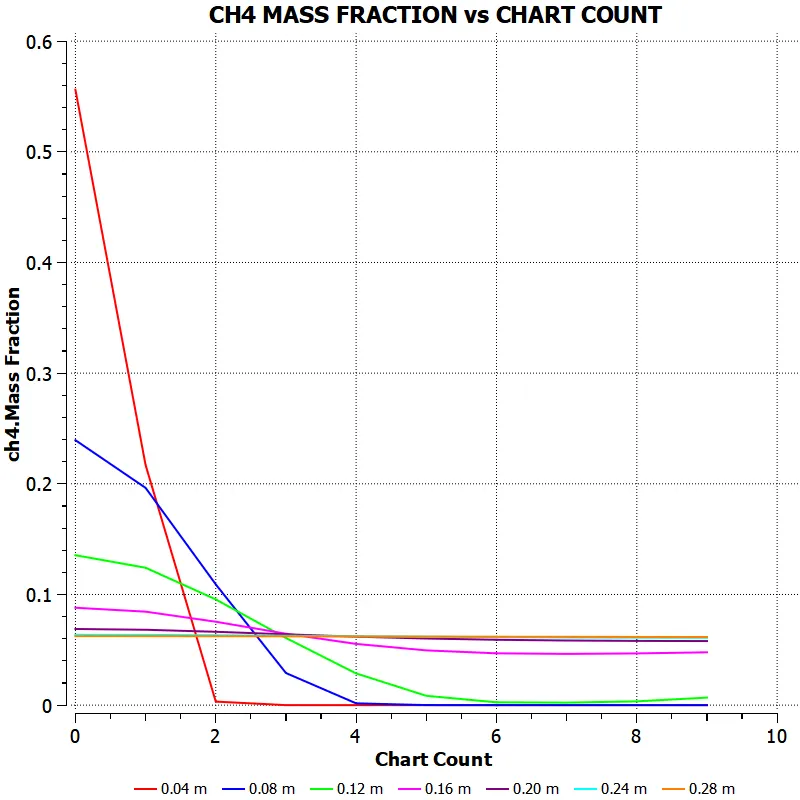
Fig.6.2.3.6. CH4 Mass Fraction Line Chart - 30% Water Content
6.2.4. CO MASS FRACTION
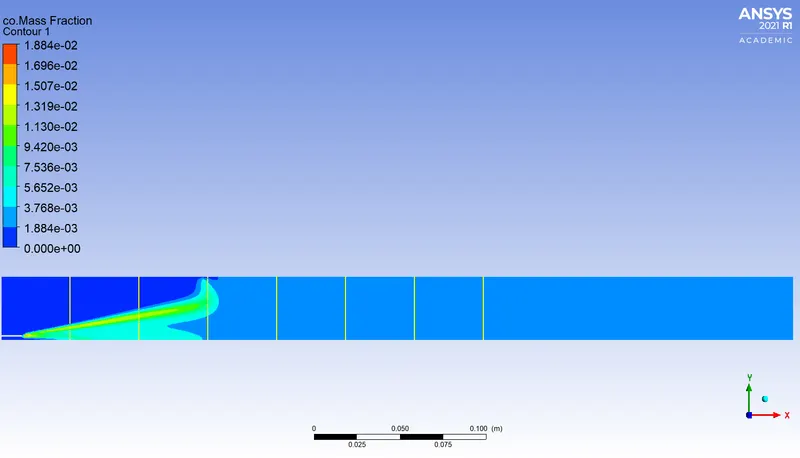
Fig.6.2.4.1. CO Mass Fraction - 10% Water Content
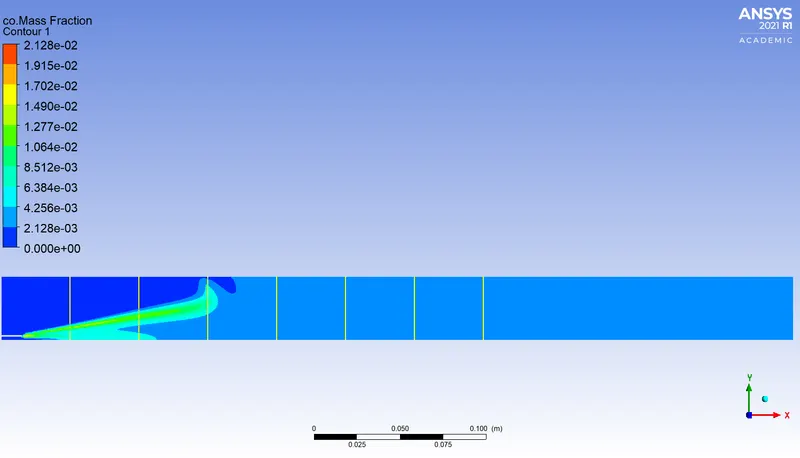
Fig.6.2.4.2. CO Mass Fraction - 20% Water Content
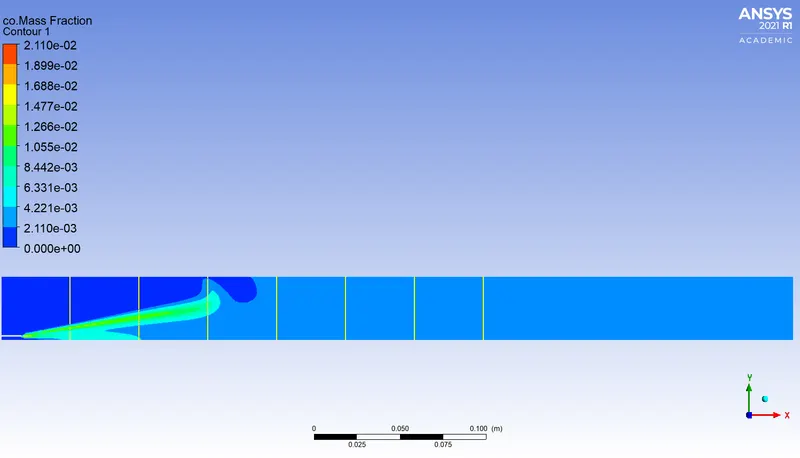
Fig.6.2.4.3. CO Mass Fraction - 30% Water Content
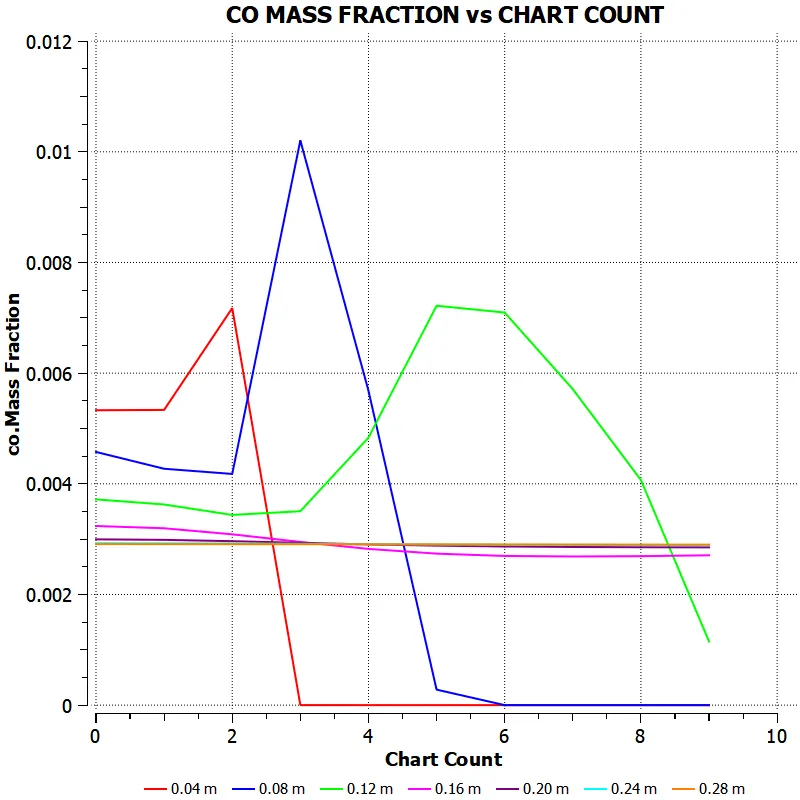
Fig.6.2.4.4. CO Mass Fraction Line Chart - 10% Water Content
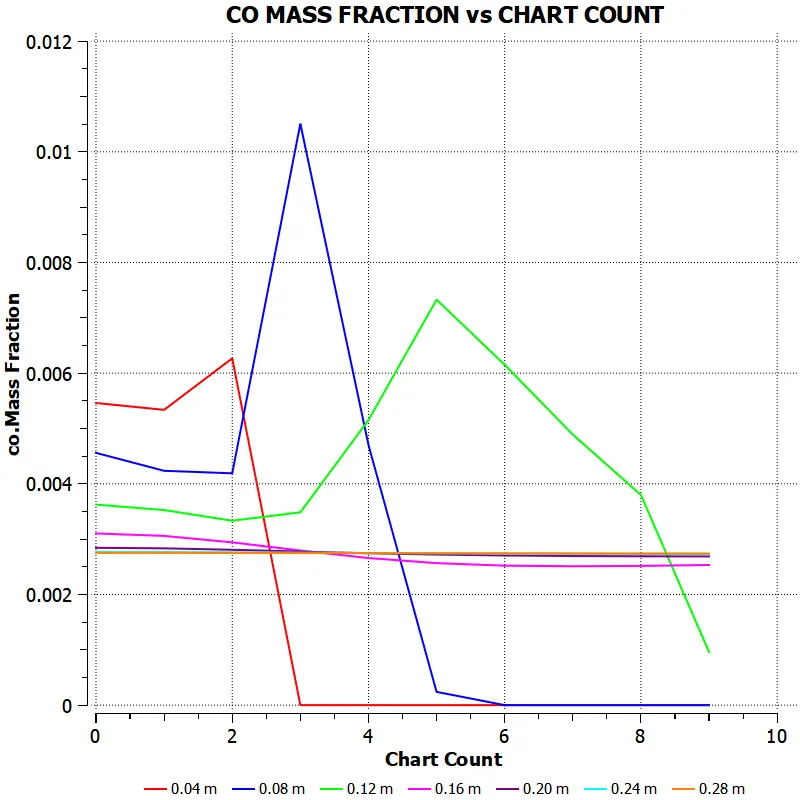
ig.6.2.4.5. CO Mass Fraction Line Chart - 20% Water Content\
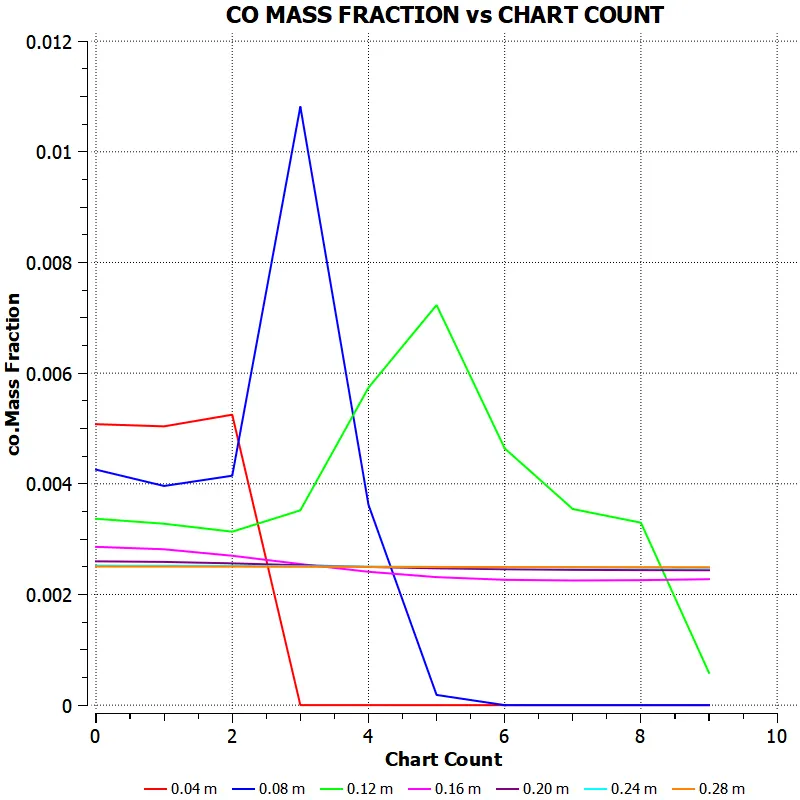
Fig.6.2.4.6. CO Mass Fraction Line Chart - 30% Water Content
6.2.5. CO2 MASS FRACTION
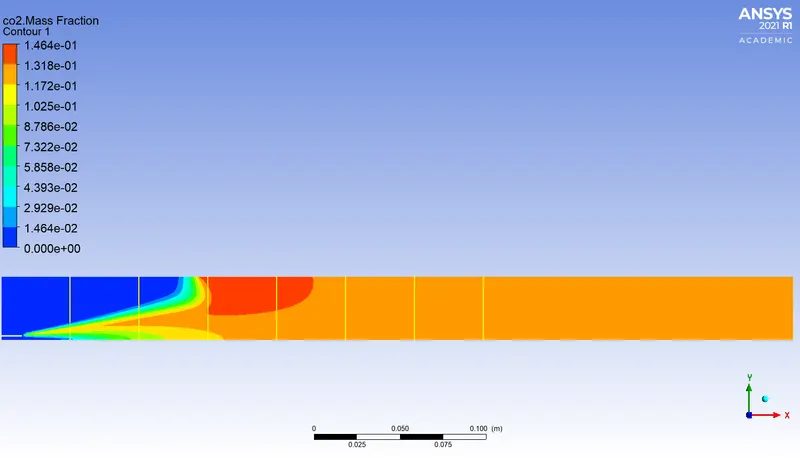
Fig.6.2.5.1. CO2 Mass Fraction - 10% Water Content
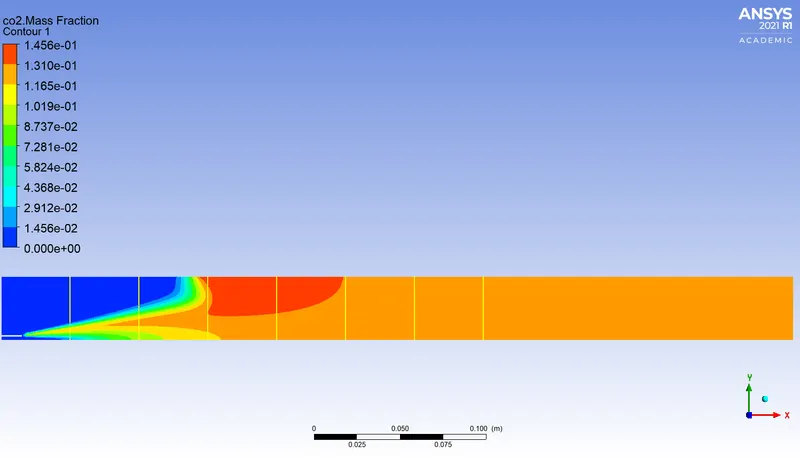
Fig.6.2.5.2. CO2 Mass Fraction - 20% Water Content
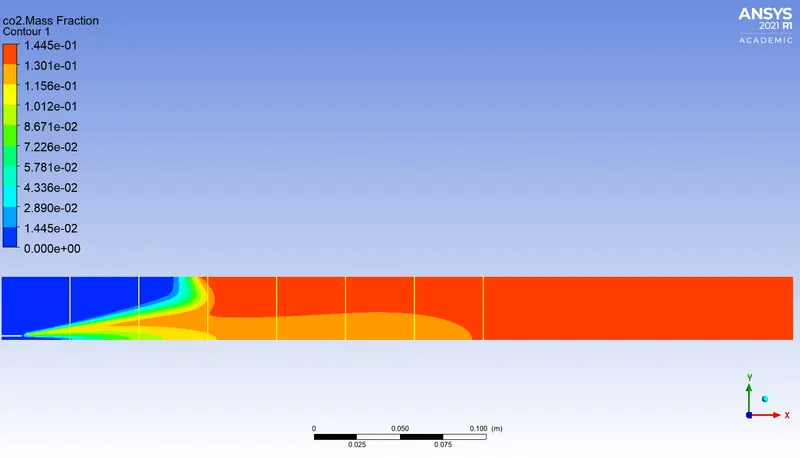
Fig.6.2.5.3. CO2 Mass Fraction - 30% Water Content
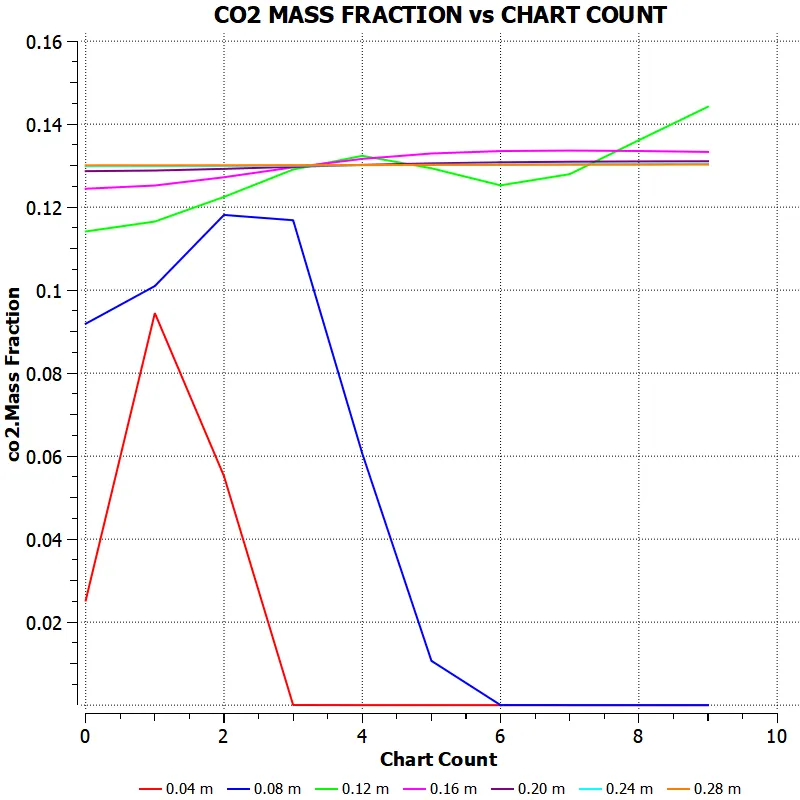
ig.6.2.5.4. CO2 Mass Fraction Line Chart - 10% Water Content
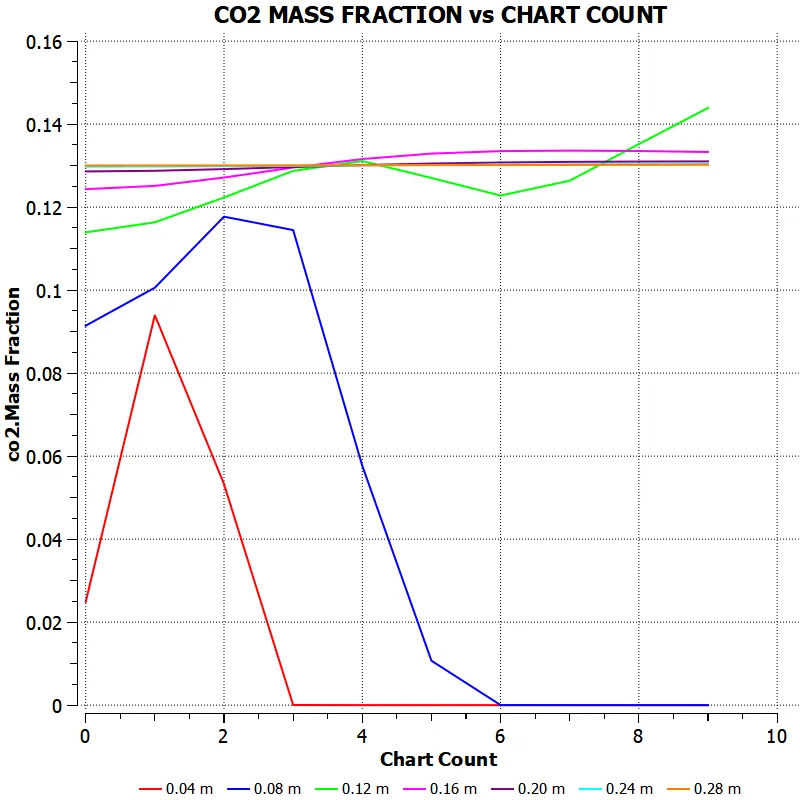
Fig.6.2.5.5. CO2 Mass Fraction Line Chart - 20% Water Content
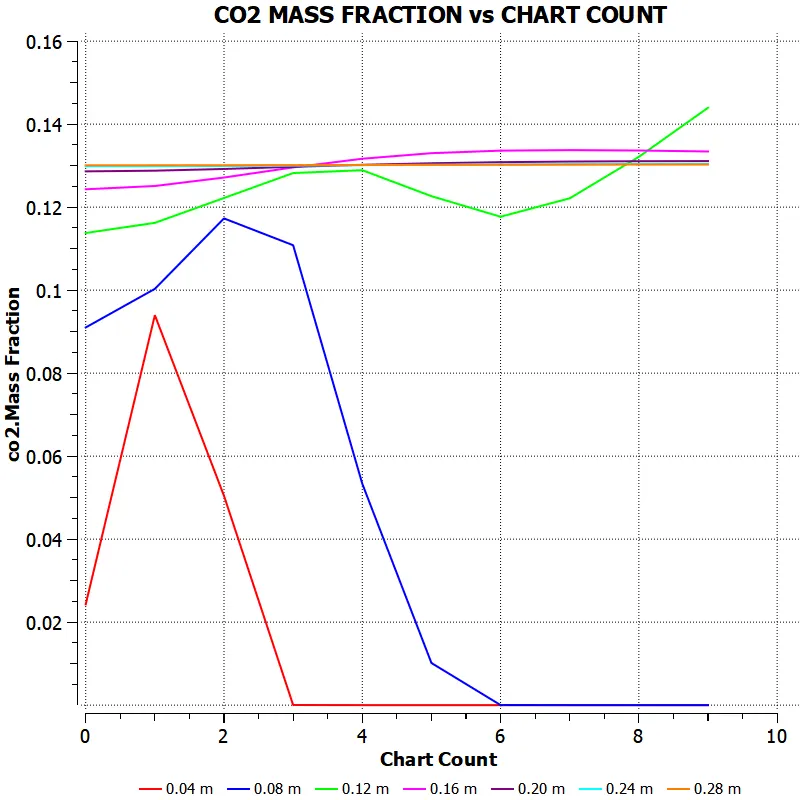
Fig.6.2.5.6. CO2 Mass Fraction Line Chart - 30% Water Content
6.2.6. H2O MASS FRACTION
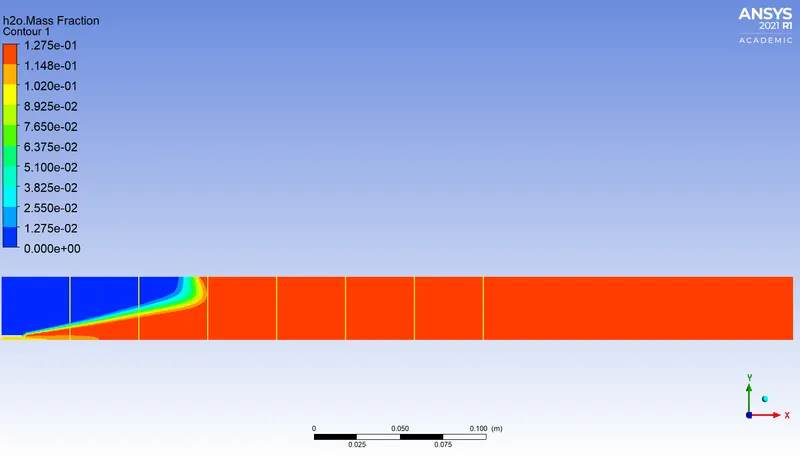
Fig.6.2.6.1. H20 Mass Fraction - 10% Water Content
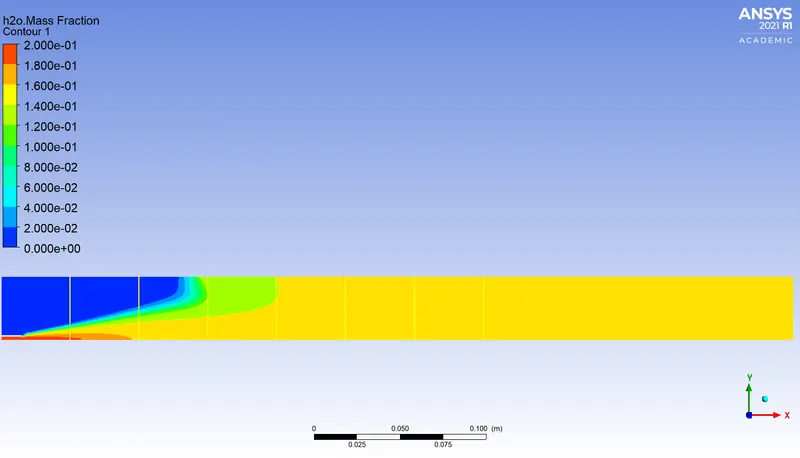
Fig.6.2.6.2. H20 Mass Fraction - 20% Water Content
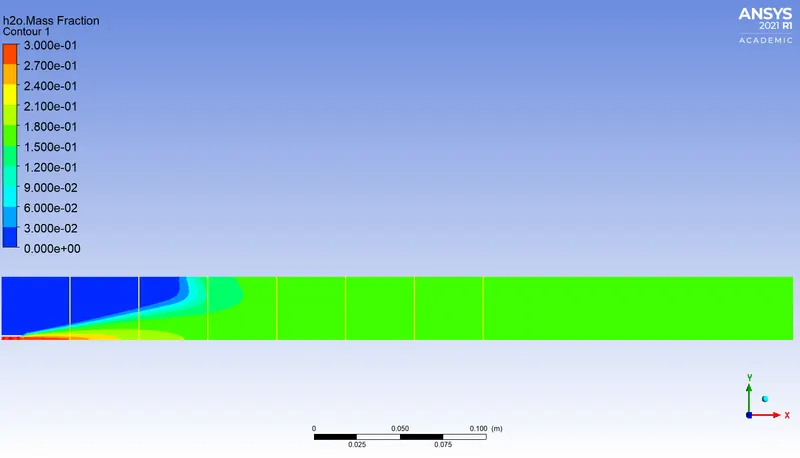
Fig.6.2.6.3. H20 Mass Fraction - 30% Water Content
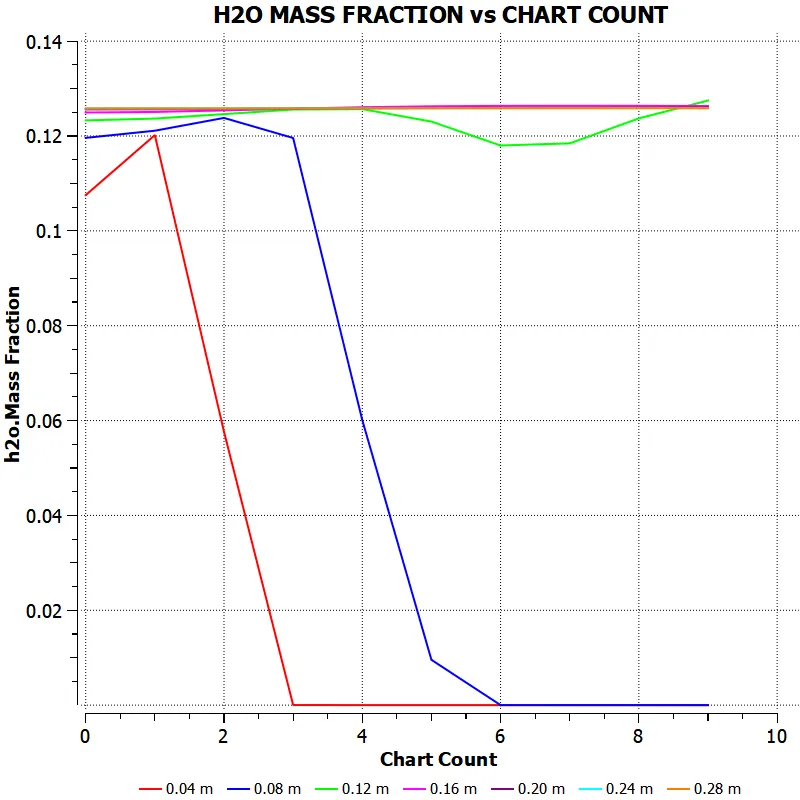
Fig.6.2.6.4. H20 Mass Fraction Line Chart - 10% Water Content
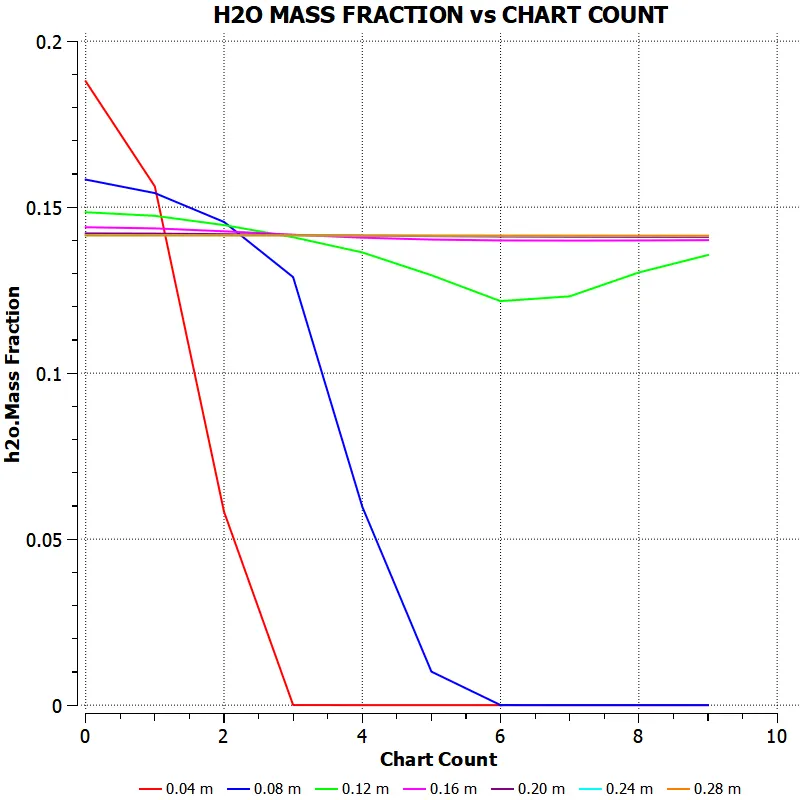
ig.6.2.6.5. H20 Mass Fraction Line Chart - 20% Water Content
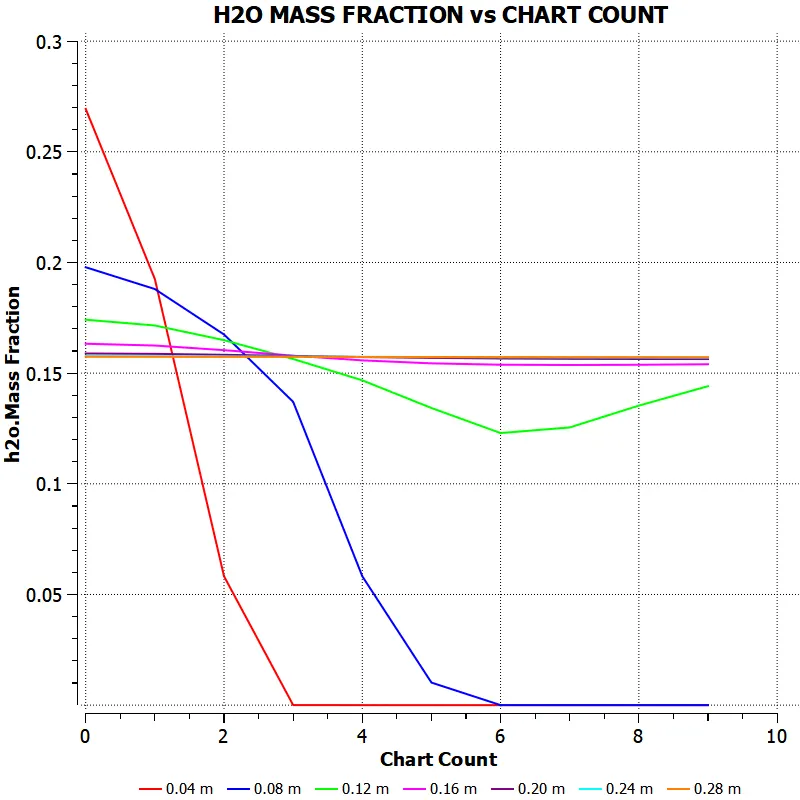
fig.6.2.6.6. H 0 Mass Fraction Line Chart - 30% Water Content
6.2.7. N2 MASS FRACTION
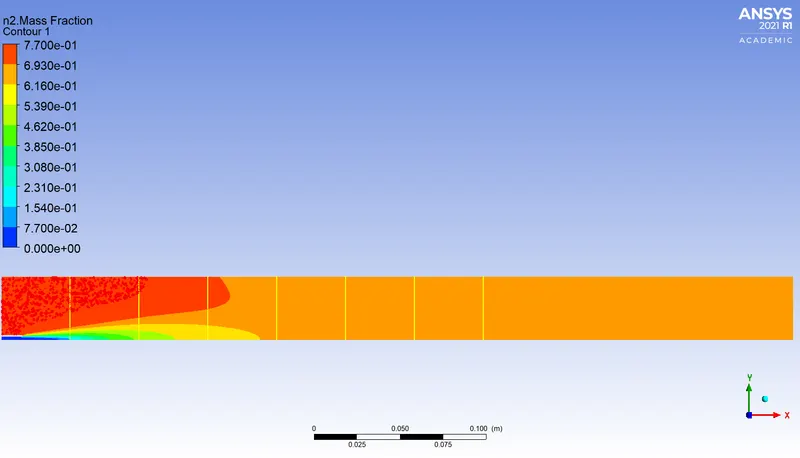
Fig.6.2.7.1. N2 Mass Fraction - 10% Water Content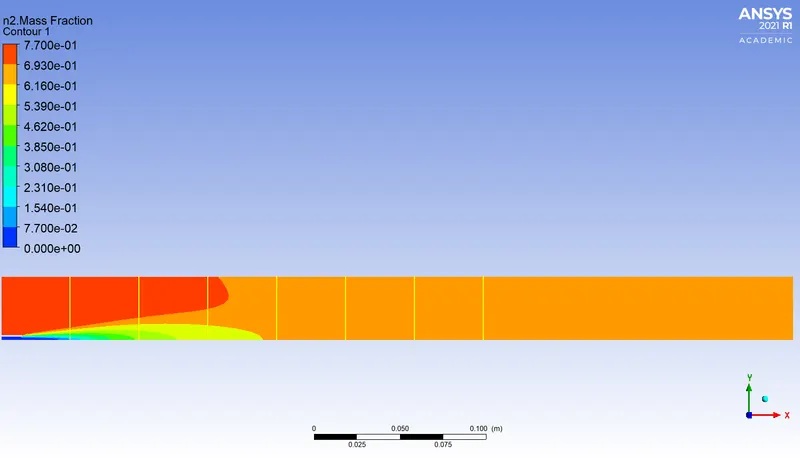
Fig.6.2.7.2. N2 Mass Fraction - 20% Water Content
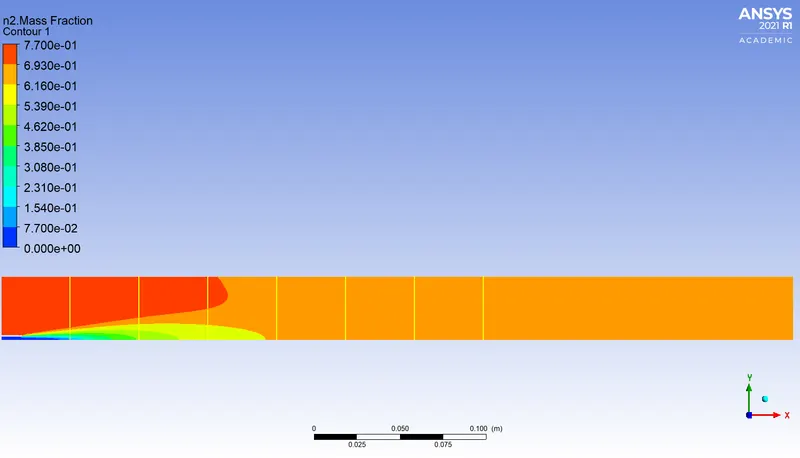
Fig.6.2.7.3. N2 Mass Fraction - 30% Water Content
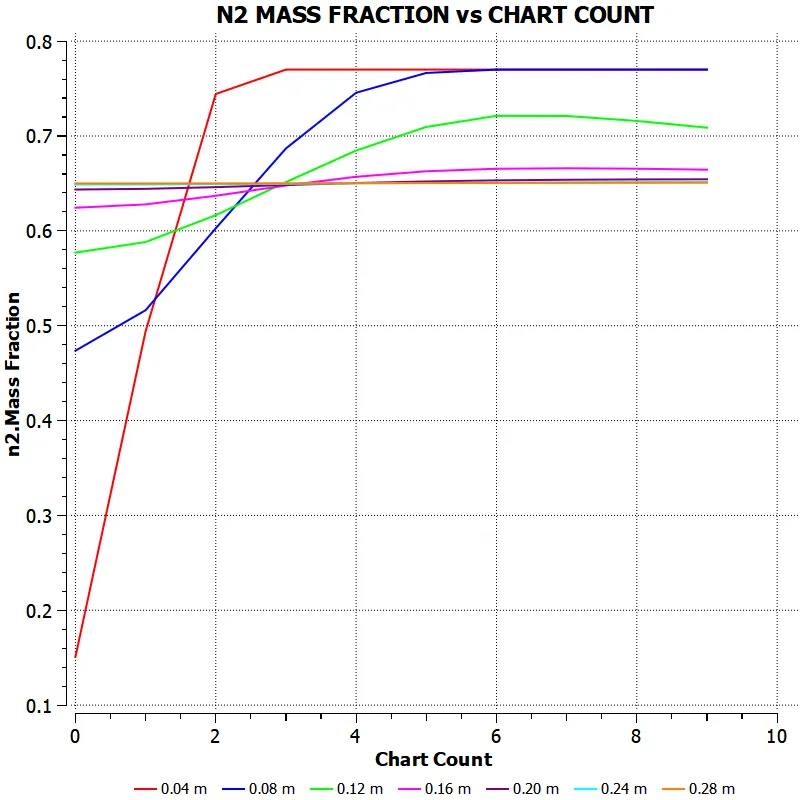
Fig.6.2.7.4. N2 Mass Fraction Line Chart - 10% Water Content
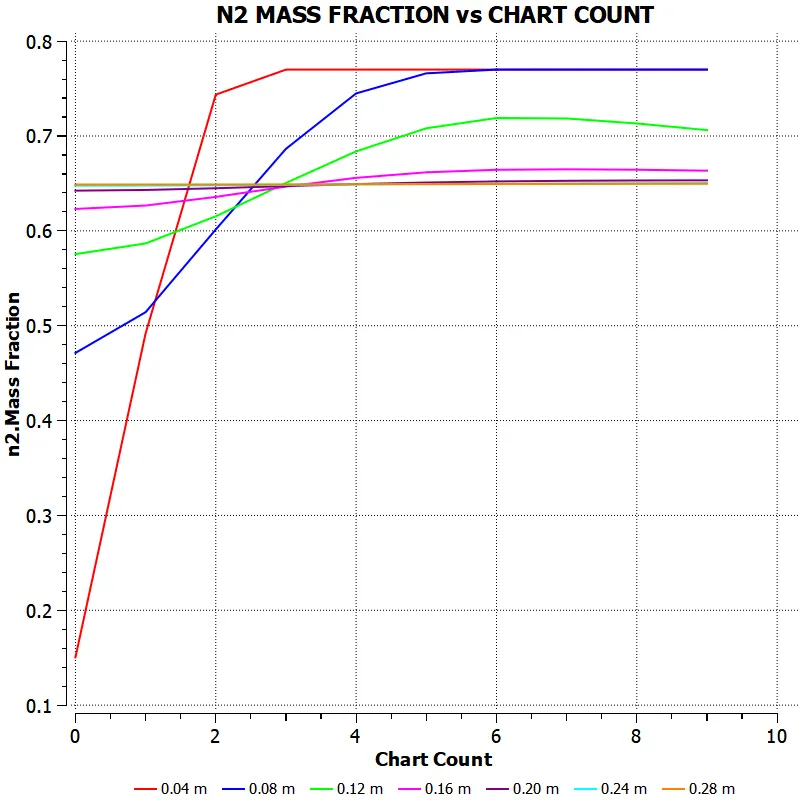
ig.6.2.7.5. N2 Mass Fraction Line Chart - 20% Water Content
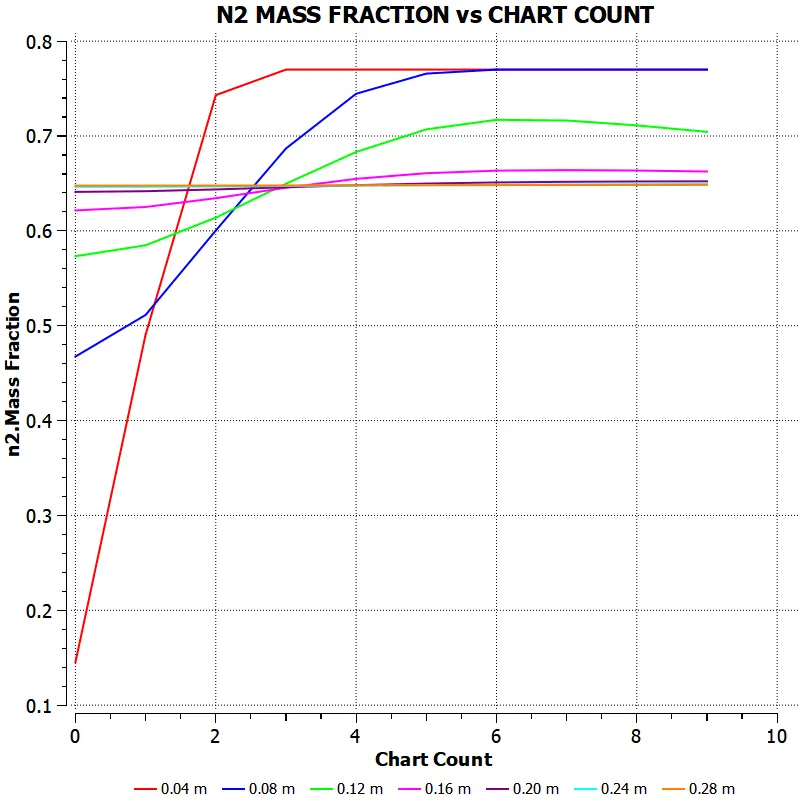
Fig.6.2.7.6. N2 Mass Fraction Line Chart - 30% Water Content
6.2.8. O2 MASS FRACTION
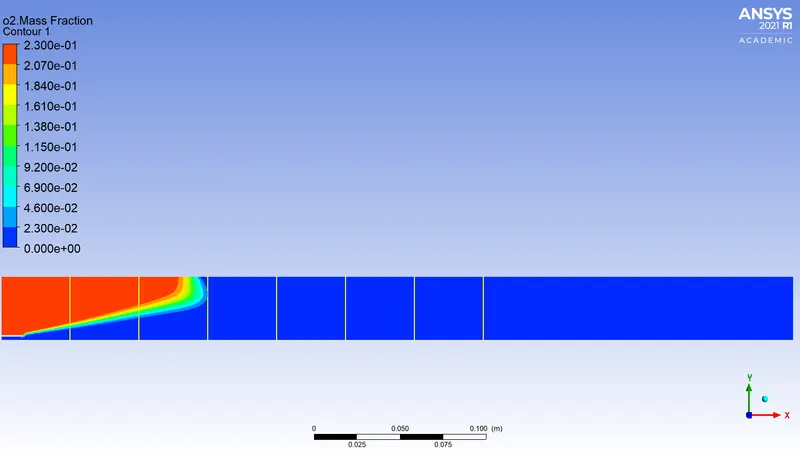
Fig.6.2.8.1. O2 Mass Fraction - 10% Water Content
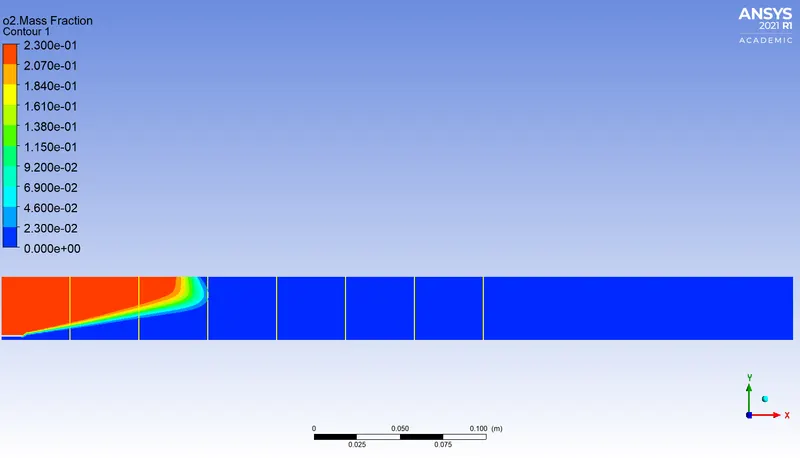
Fig.6.2.8.2. O2 Mass Fraction - 20% Water Content
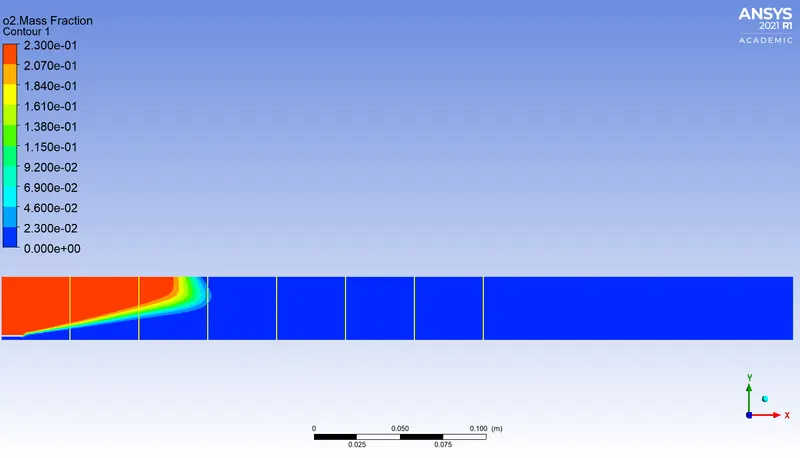
Fig.6.2.8.3. O2 Mass Fraction - 30% Water Content
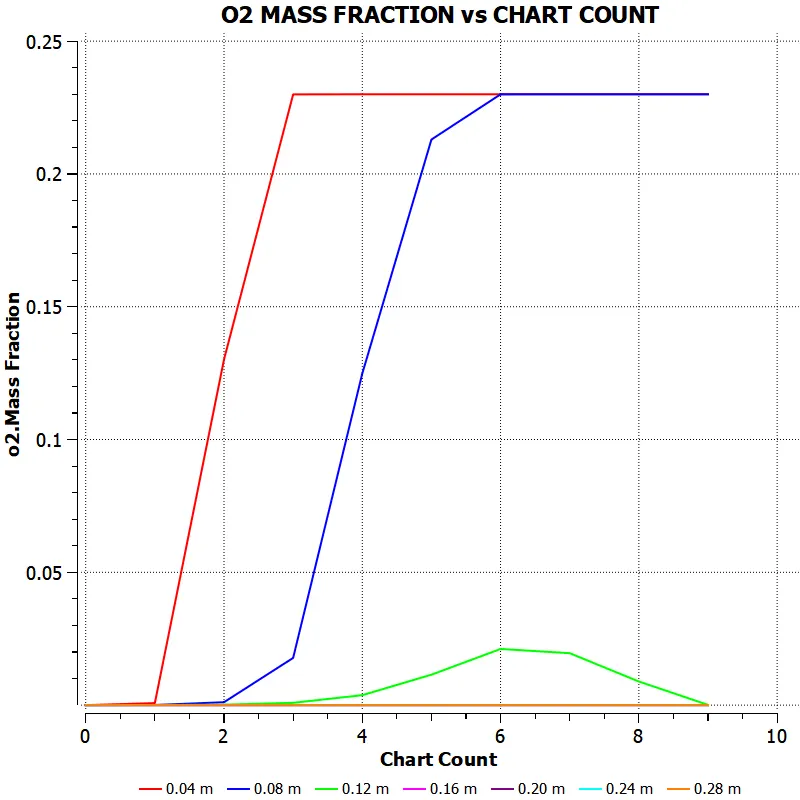
Fig.6.2.8.4. O2 Mass Fraction Line Chart - 10% Water Content
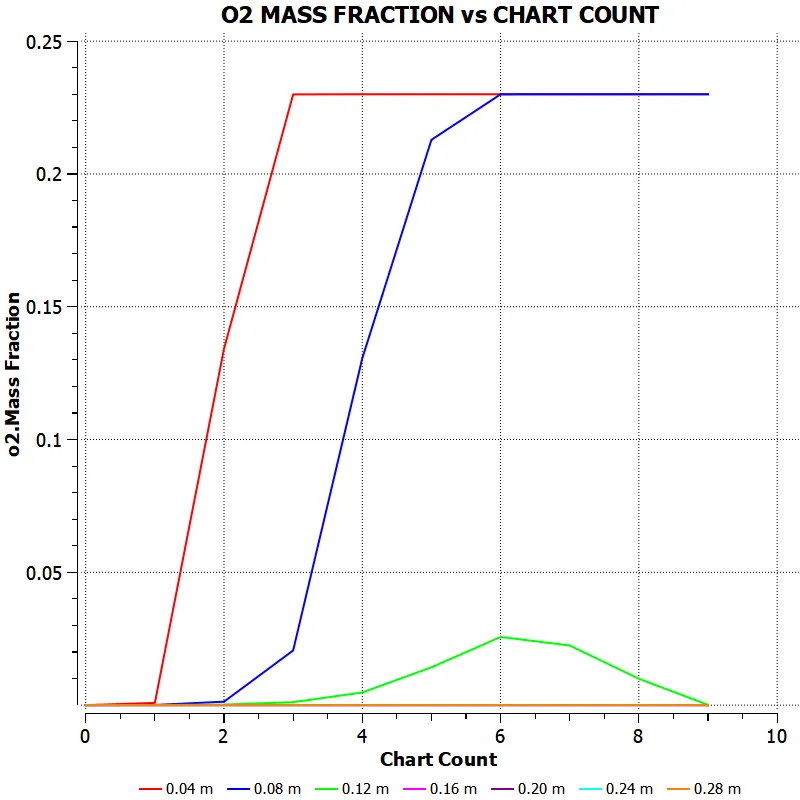
Fig.6.2.8.5. O2 Mass Fraction Line Chart - 20% Water Content
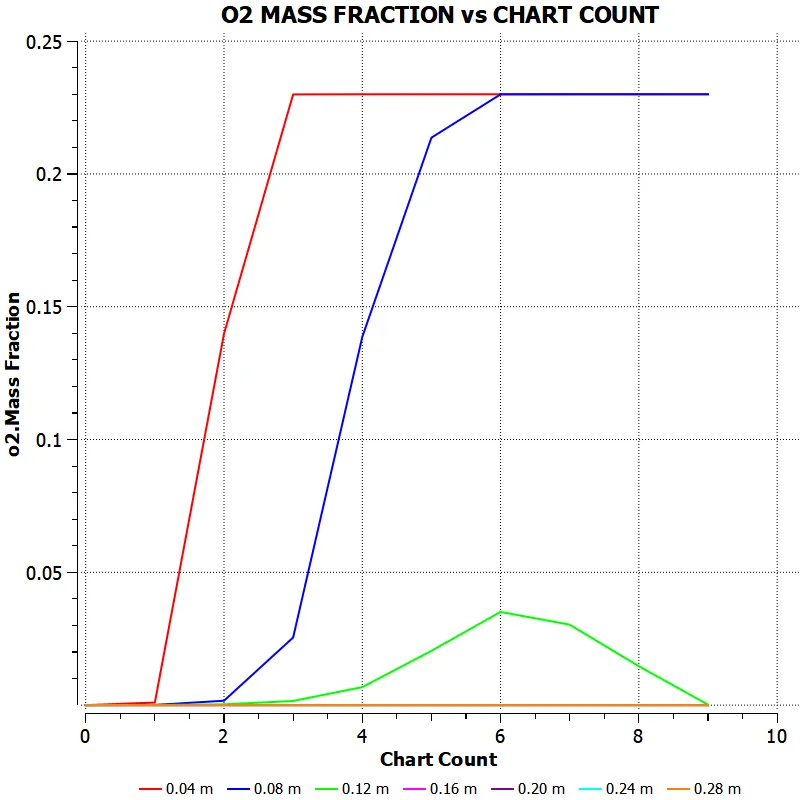
ig.6.2.8.6. O2 Mass Fraction Line Chart - 30% Water Content
.2.9. POLLUTANT NOx MASS FRACTION
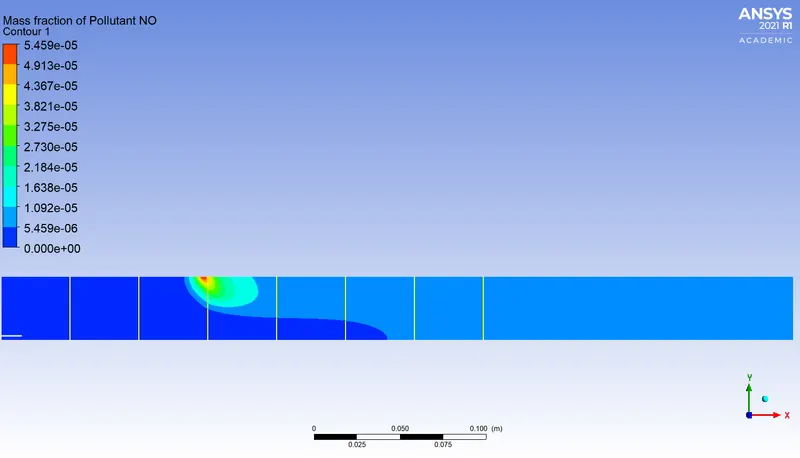
Fig.6.2.9.1. Pollutant NOx Mass Fraction - 10% Water Content
 \
\
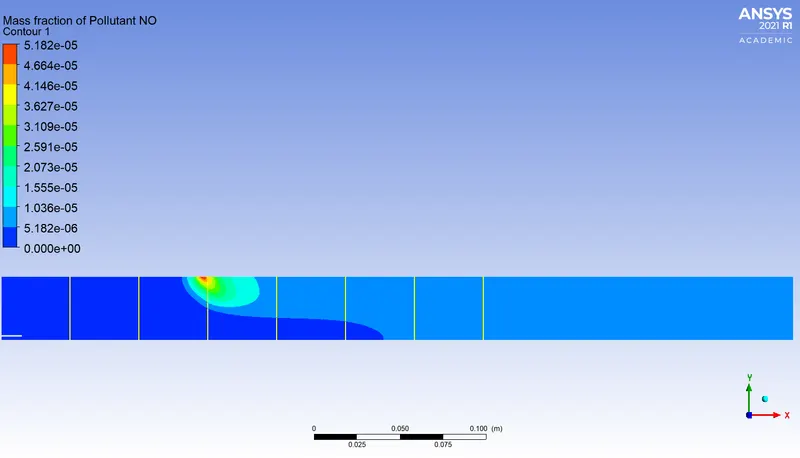
Fig.6.2.9.2. Pollutant NOx Mass Fraction - 20% Water Content
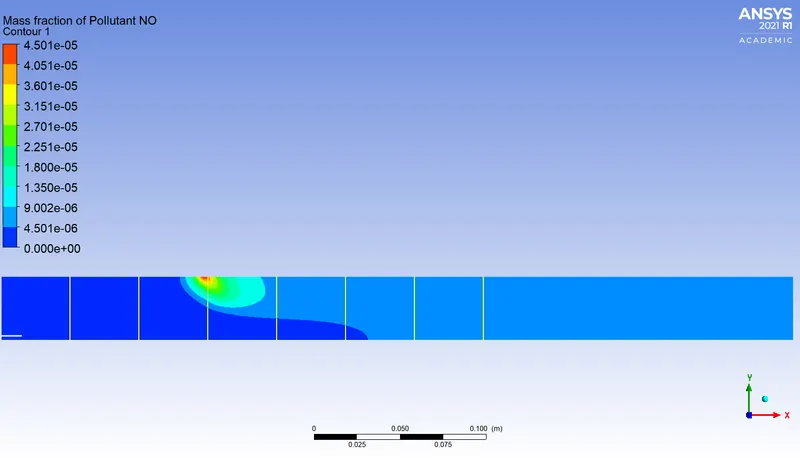
Fig.6.2.9.3. Pollutant NOx Mass Fraction - 30% Water Content
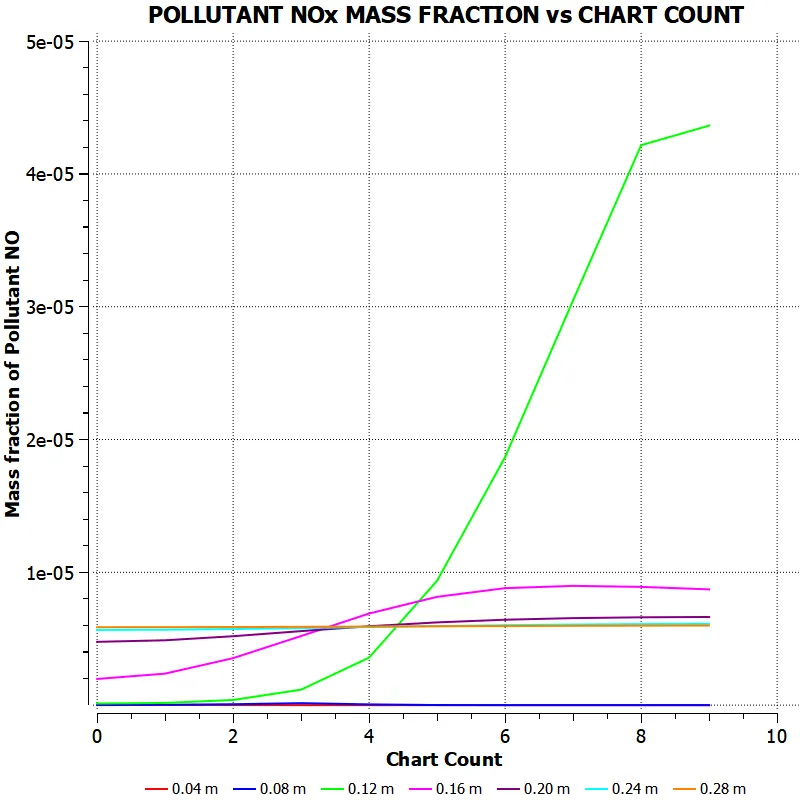
Fig.6.2.9.4. Pollutant NOx Mass Fraction Line Chart - 10% Water Content
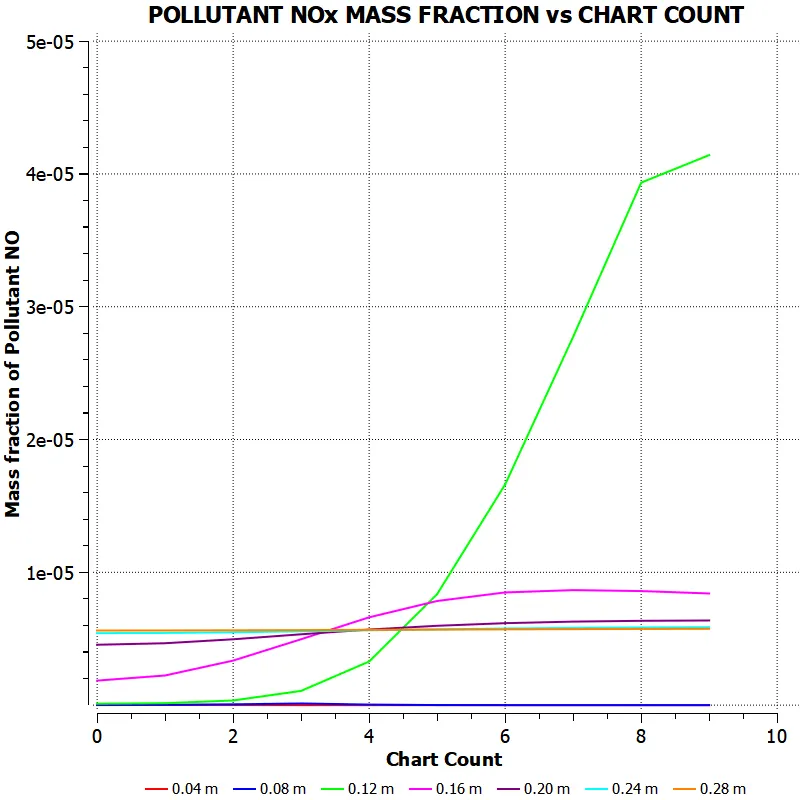
Fig.6.2.9.5. Pollutant NOx Mass Fraction Line Chart - 20% Water Content
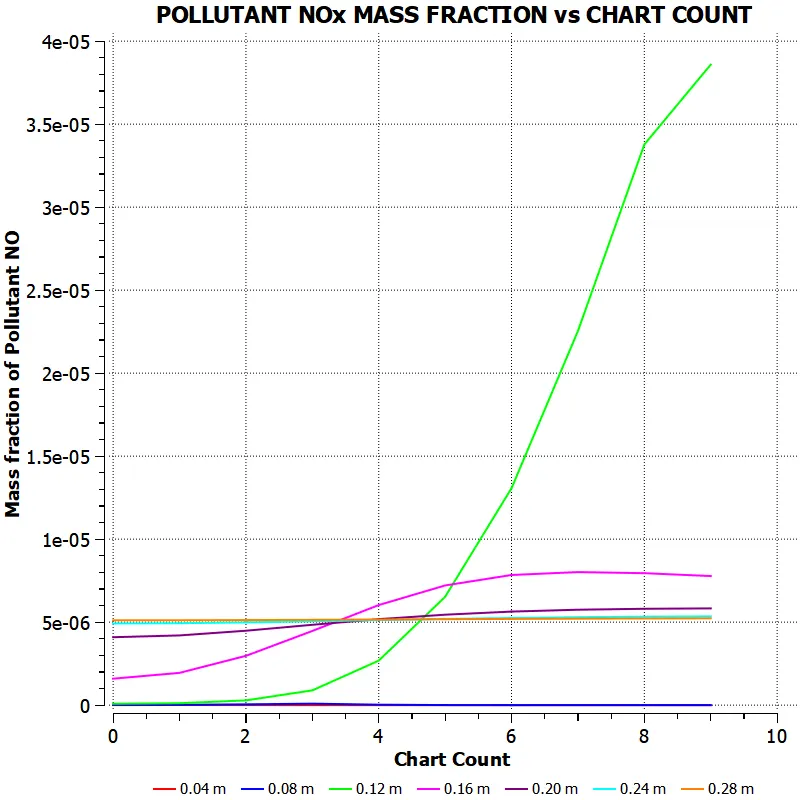
Fig.6.2.9.6. Pollutant NOx Mass Fraction Line Chart - 30% Water Content
6.2.10. SOOT MASS FRACTION
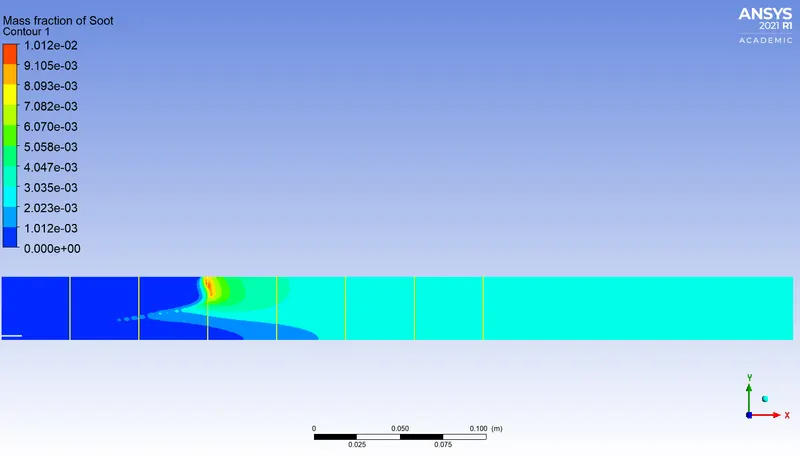
Fig.6.2.10.1. Soot Mass Fraction - 10% Water Content
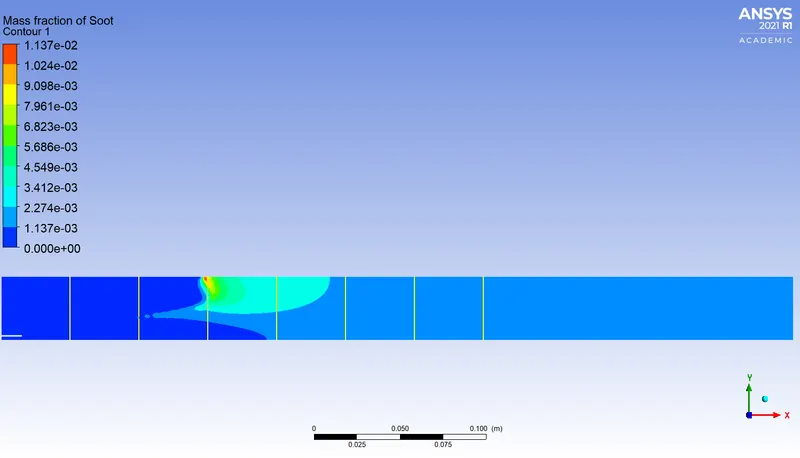
Fig.6.2.10.2. Soot Mass Fraction - 20% Water Content
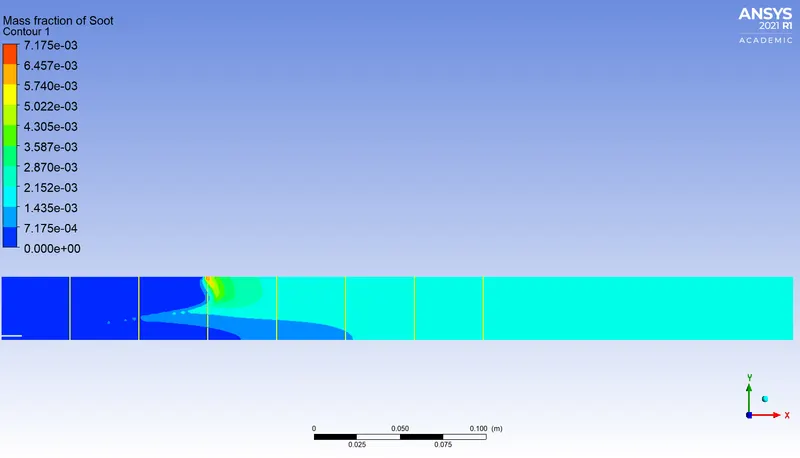
Fig.6.2.10.3. Soot Mass Fraction - 30% Water Content
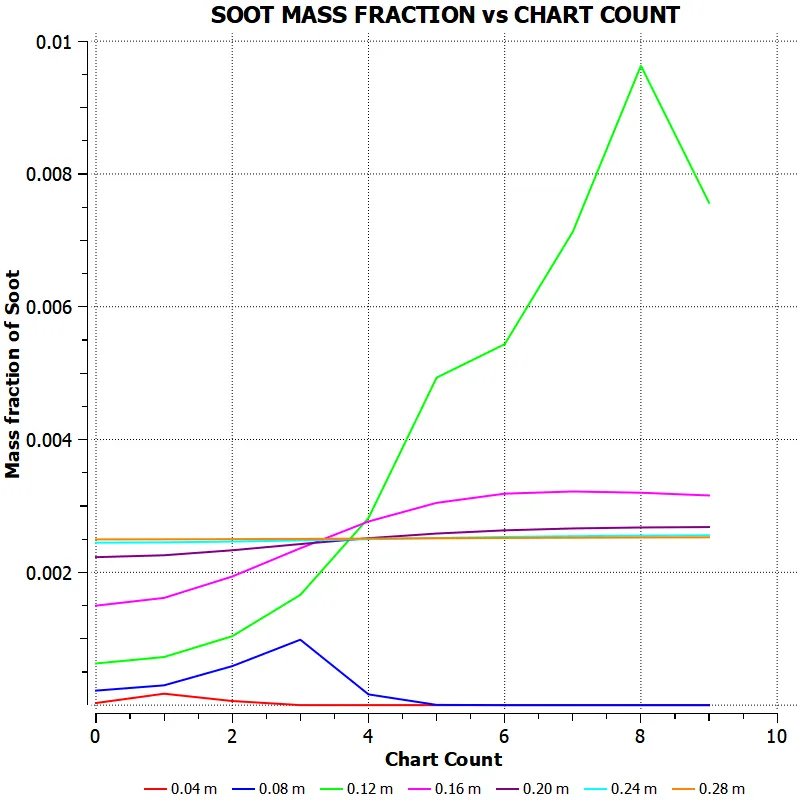
Fig.6.2.10.4. Soot Mass Fraction Line Chart - 10% Water Content
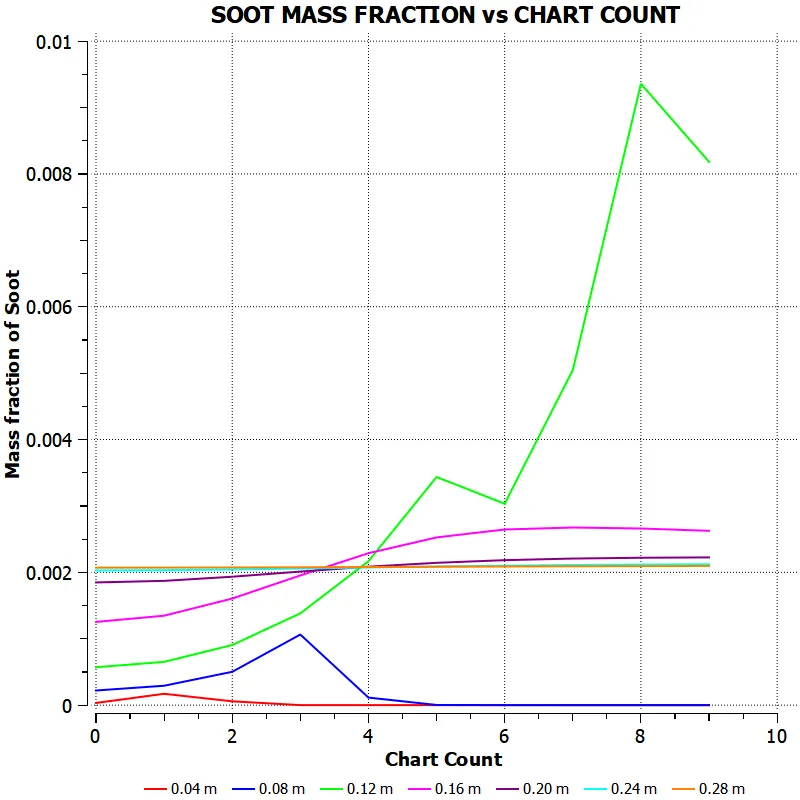
ig.6.2.10.5. Soot Mass Fraction Line Chart - 20% Water Content
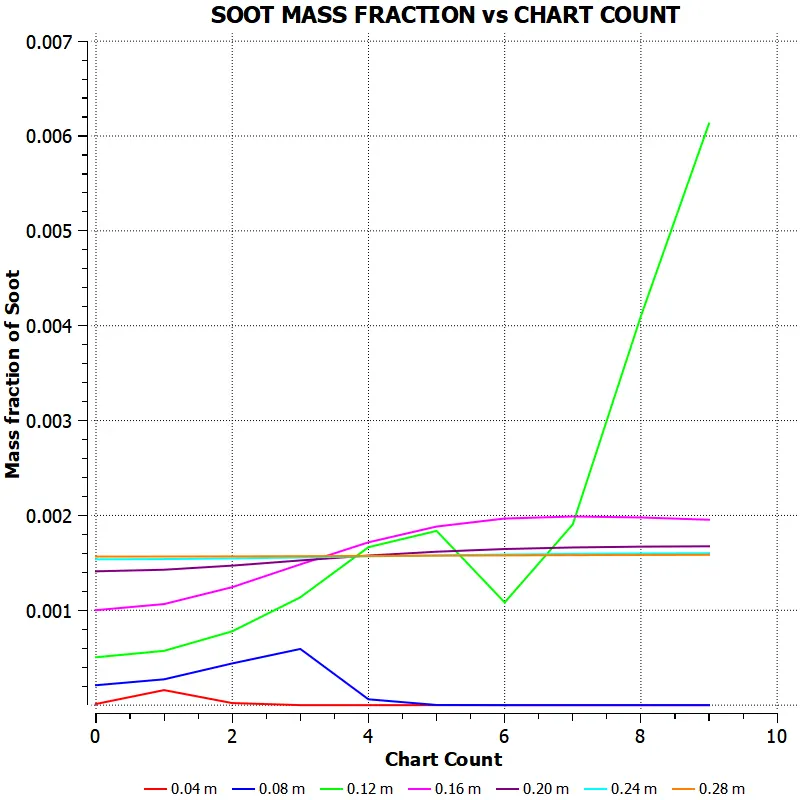
Fig.6.2.10.6. Soot Mass Fraction Line Chart - 30% Water Content
7. CONCLUSION
- A region of maximum temperature (2231 K) occurs around a distance of 0.12 m, and attains a converged value around 0.20 m
from inlet. - High concentration of CH is observed at the fuel inlet region, and the concentration decreases and attains a converged value
around 0.24 m from inlet. - Higher concentration of CO is observed from 0.03-0.11 m, and attains a converged value around 0.14 m from inlet. Similarly,
higher mass fraction of CO is observed from 0.12-0.18 m, and attains a converged value at 0.19 m from inlet. - Higher concentration of water occurs beyond 0.12 m from the inlet while O2 mass fraction decreases and attains nil value
beyond 0.12 m from the inlet. - Higher mass fraction of NOx and Soot are observed at 0.12 m while achieving a converged value beyond 0.24 m and 0.20 m
respectively from the inlet.
7.2. CASE 2
- Mass fraction of CH4 decreases when water content is increased due to combustion, resulting in zero mass fraction beyond 0.22
m and 0.18 m under 30% and 30% water content. - A higher concentration of CO presence occurs until 0.12 m from inlet under all water content variations, and a negligible amount
still occurs at the outlet. - CO2’s mass fraction increases beyond 0.12 m, as water content increases, resulting in lower emission of CO.
- H2O’s mass fraction decreases beyond 0.12 m from inlet as water content is increased, due to combustion.
- There is no effect of water content on the mass fraction of N as it is inert.
- O2’s mass fraction decreases beyond 0.12 m from inlet as water content increases, due to the combustion of fuel, while higher
concentration occurs until 0.10 m. - Higher concentration of Nox mass fraction occurs at 0.12 m under all water content, while it reduced drastically to occur at
negligible value at the outlet resulting in a negligible emission of NOx. - Soot’s mass fraction decreases as water content is increased, resulting in better emission control.