Week - 10 Hyperelastic Material Models
OBJECTIVE:
- To perform a uniaxial tensile loading on the given specimen using the given stress-strain data.
- To calculate the Mooney Rivlin and Ogden material constants and compare the both using stress-strain data from a Dogbone specimen tensile test with 100 percent strain.
- To find out the most suitable hyperelastic material model among Mooney rivlin and Odgen material models for this kind of an analysis.
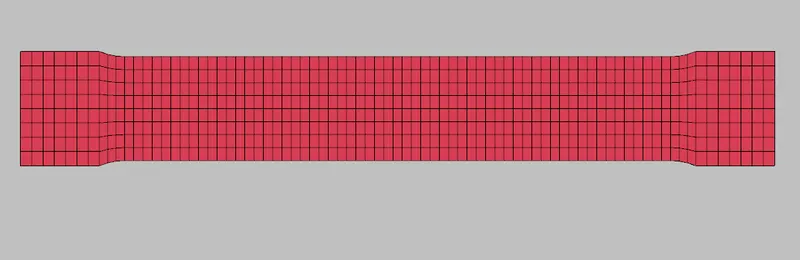
GIVEN DOGBONE SPECIMEN:
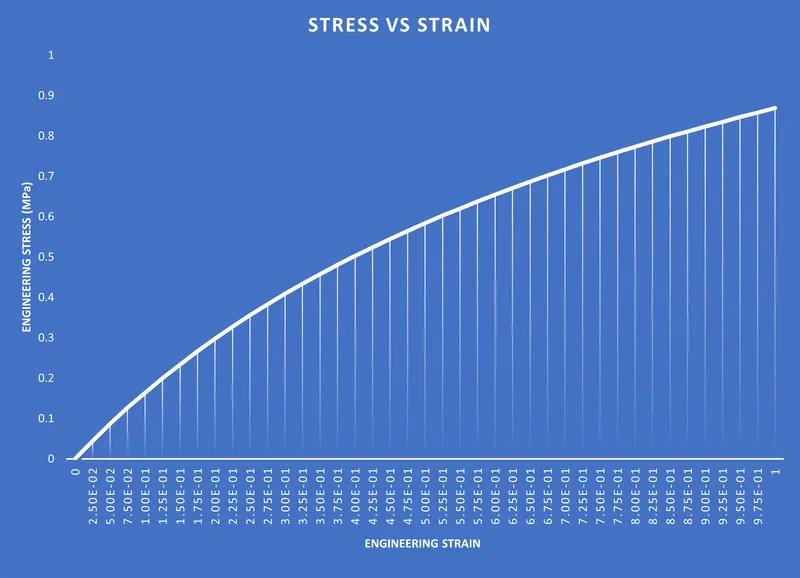
GIVEN MATERIAL DATA:
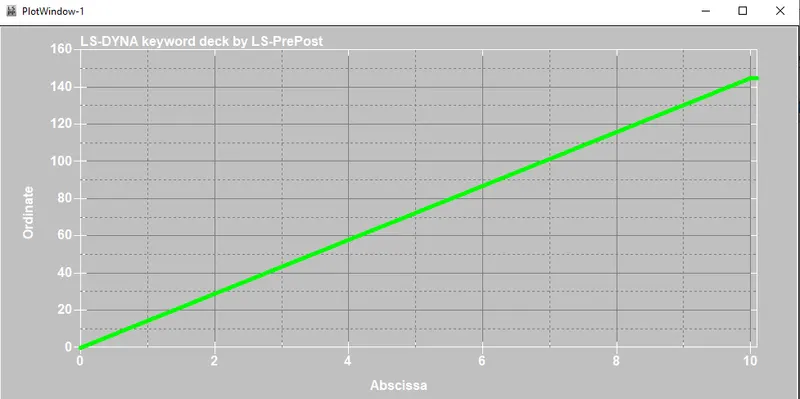
INPUT DISPLACEMENT CURVE FOR UNIAXIAL TENSILE LOADING:
MOONEY RIVLIN HYPER-ELASTIC MATERIAL MODEL:
The comparison is made between the number of constants (N=1,2 and 3) in the Money Rivlin hyperelastic material model:
MATERIALS CARD:
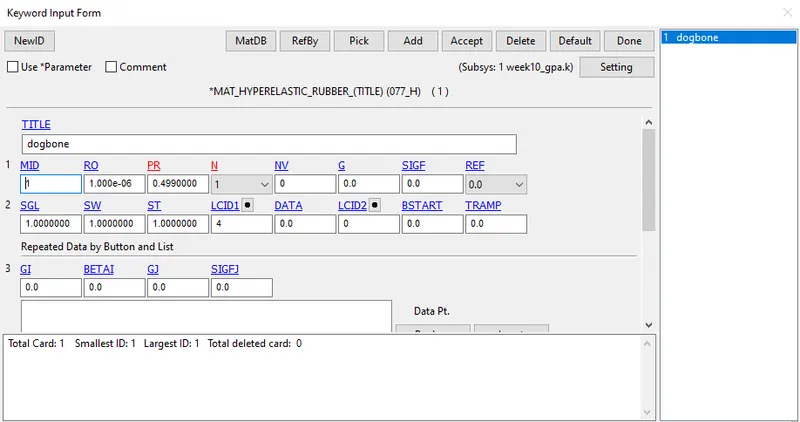
CASE 1: MOONEY RIVLIN NUMBER OF CONSTANTS- N=1:
For the first degree polynomial the number of constants=2
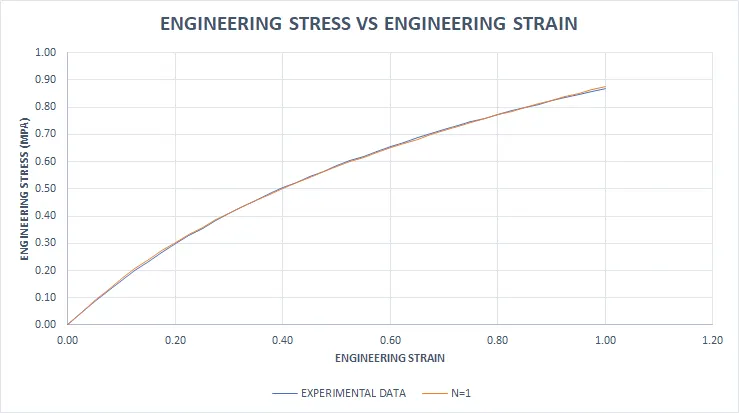
The Mooney Rivlin constants for N=1 are:
| c1 | 1.77E-04 |
| c2 | 1.47E-04 |
The values of the constants are obtained from the d3hsp file.
The plot compares the experimental stress-strain curve to the curve created by the Mooney Rivlin material model for N=1.
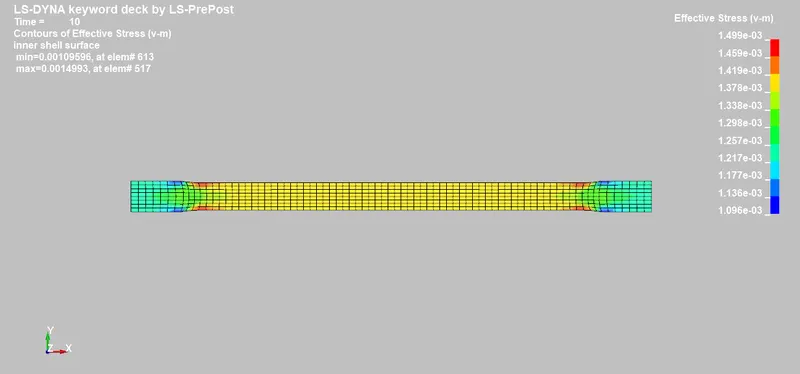
EFFECTIVE STRESS:
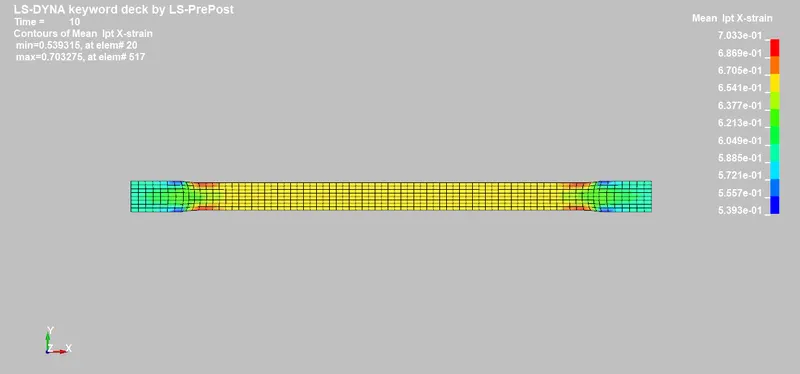
X-STRAIN:
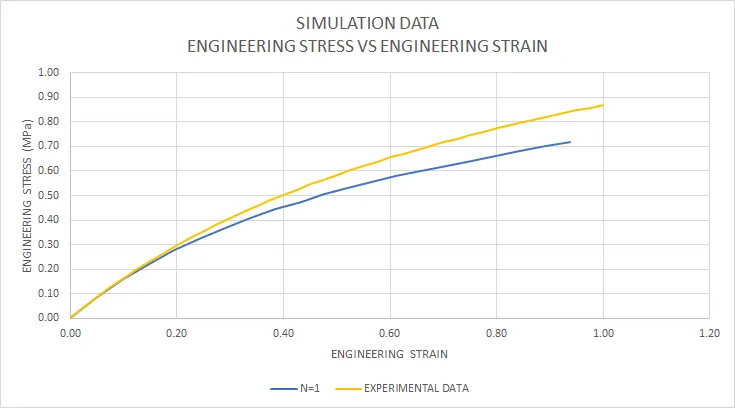
The plot below compares the simulation results (stress vs strain) from the Mooney Rivlin material model to the experimental data. The true stress and true strain values from the simulation are converted to engineering stress and engineering strain.
CASE 2: MOONEY RIVLIN NUMBER OF CONSTANTS- N=2:
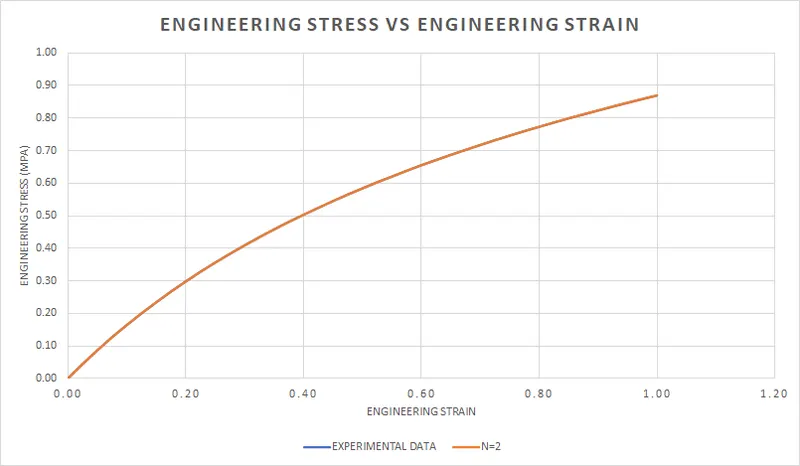
The Mooney Rivlin constants for N=2 are:
| Constant C10= 0.2595E-03 |
| Constant C01= 0.4594E-04 |
| Constant C11= -0.2092E-04 |
| Constant C20= 0.2914E-05 |
| Constant C02= 0.1017E-05 |
The plot compares the experimental stress-strain curve to the curve created by the Mooney Rivlin material model for N=2.
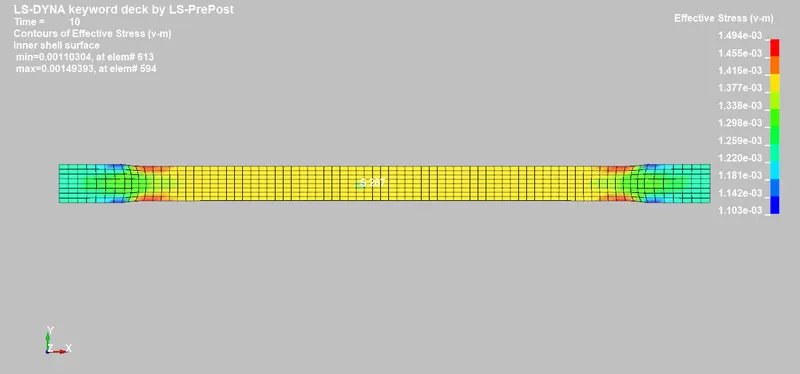
EFFECTIVE STRESS:
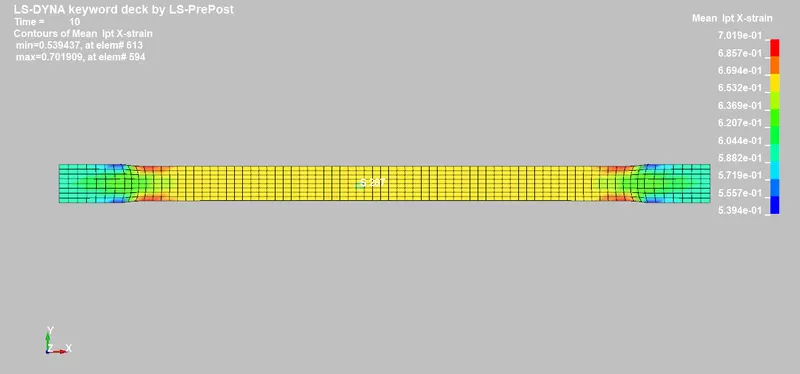
X STRAIN:
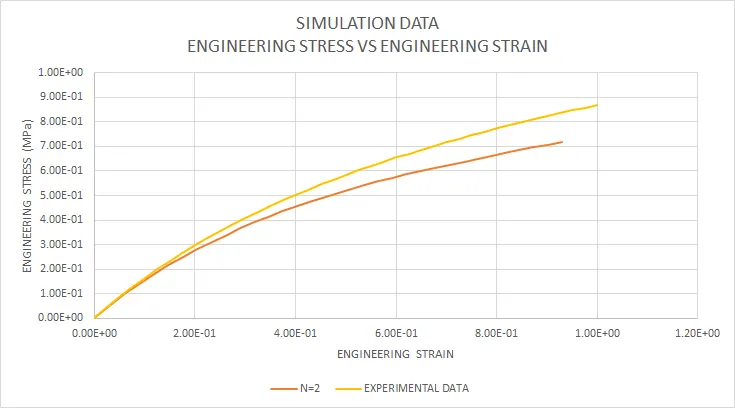
The plot below compares the simulation results (stress vs strain) from the Mooney Rivlin material model to the experimental data.The true stress and true strain values from the simulation are converted to engineering stress and engineering strain.
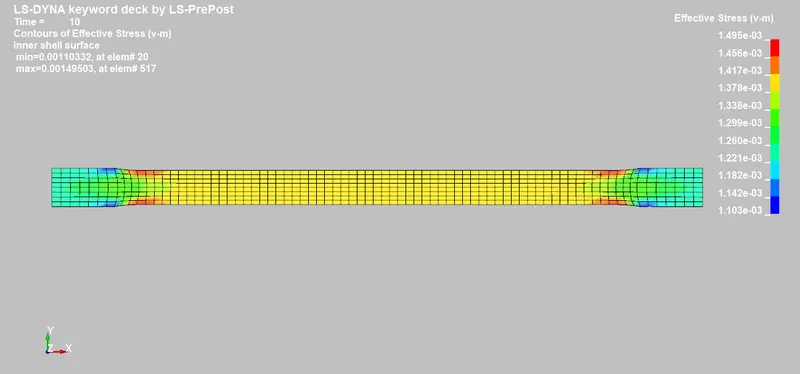
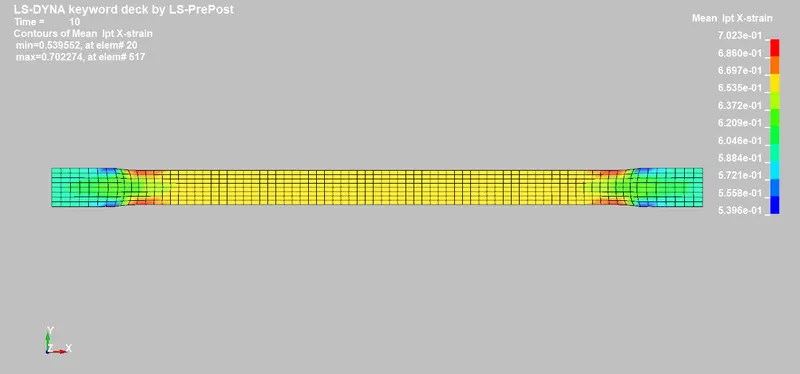
CASE 3: MOONEY RIVLIN NUMBER OF CONSTANTS- N=3:
The Mooney Rivlin constants for N=3 are:
| Constant C10= 0.2611E-03 |
| Constant C01= 0.4420E-04 |
| Constant C11= -0.6077E-05 |
| Constant C20= -0.2666E-05 |
| Constant C02= -0.9966E-05 |
| Constant C30= 0.1565E-06 |
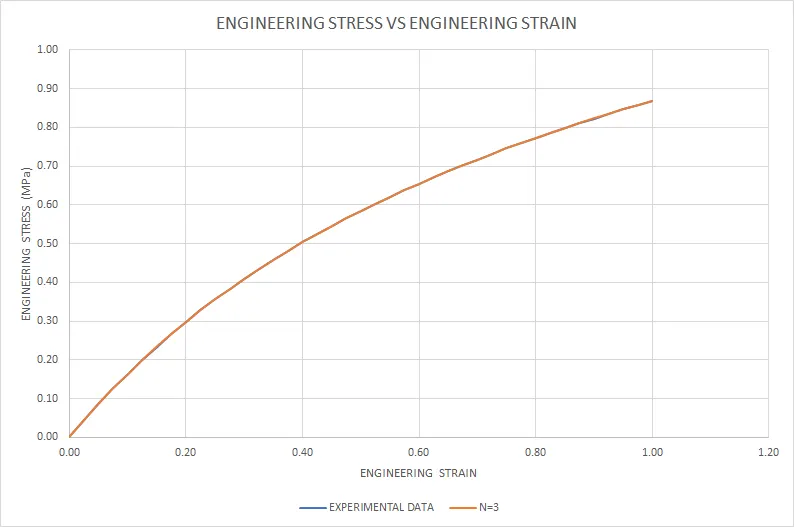
The plot compares the experimental stress-strain curve to the curve created by the Mooney Rivlin material model for N=3.
EFFECTIVE STRESS:
X STRAIN:
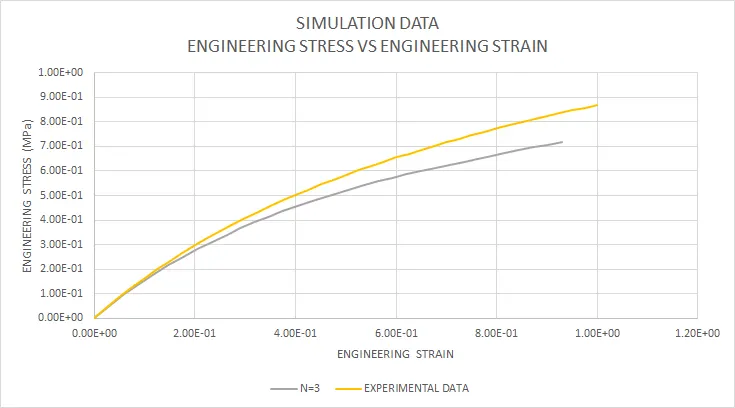
The plot below compares the simulation results (stress vs strain) from the Mooney Rivlin material model to the experimental data. The true stress and true strain values from the simulation are converted to engineering stress and engineering strain.
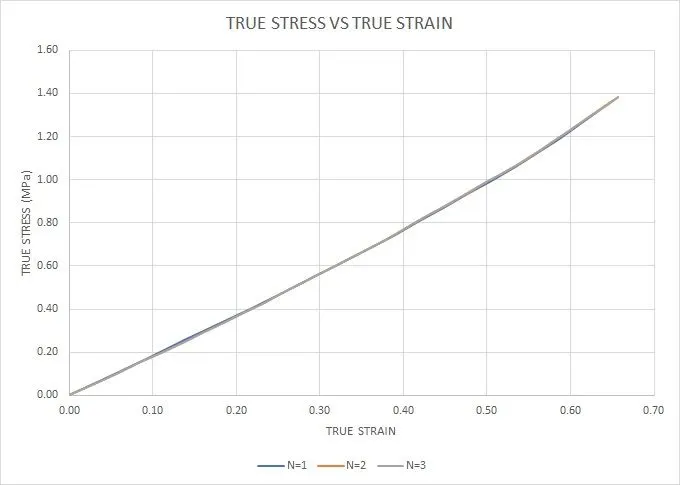
COMPARISON BETWEEN N=1,2 AND 3 FOR MOONEY RIVLIN MATERIAL MODELING:
COMPARISON BETWEEN N=1,2 AND 3 FOR MOONEY RIVLIN MATERIAL MODELING TO THE EXPERIMENTAL DATA:
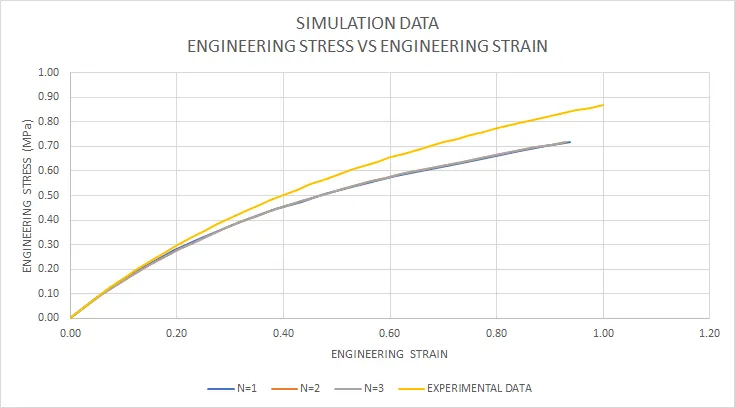
- It is clear from the plot that the values of the stress and strain for different values of N are more or less the same.
- It is expected to have a better plot close to the input data with higher values of N.
- The difference in the results from the experimental and simulation data is due to the slight differences in the input material properties and the input displacement curve.
ODGEN HYPER ELASTIC MATERIAL MODEL:
The comparison is made between the number of constants (N=1,3 and 5) in the Odgen hyperelastic material model:
MATERIALS CARD:
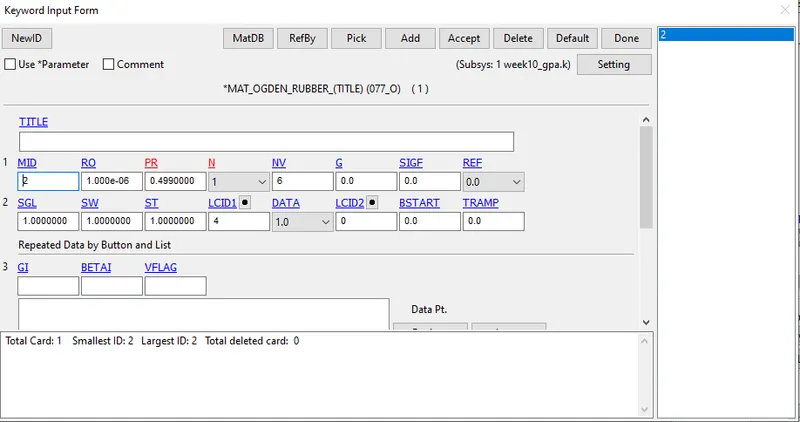
CASE 4: ODGEN HYPERELASTIC MATERIAL MODEL AT N=1:
The constants are:
| mu(1)= 9.1076025253111E-04 |
| alpha(1)= 1.3427238671930E+00 |
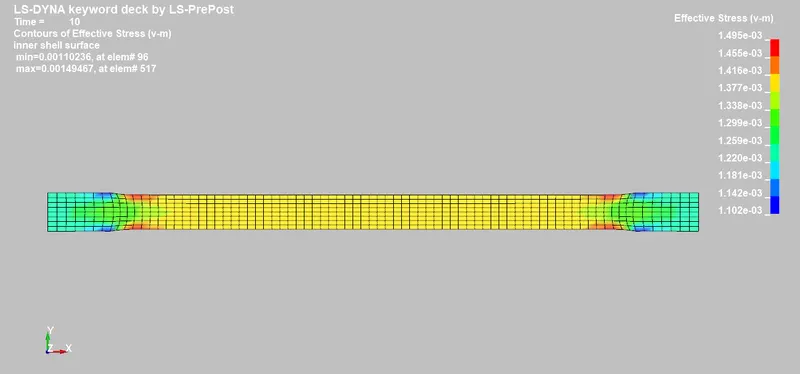
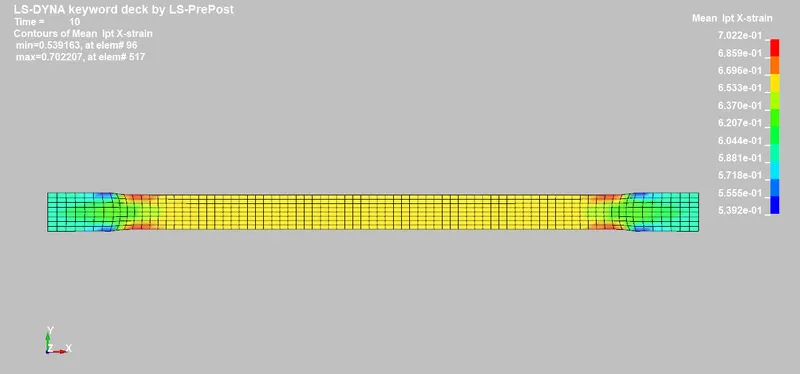
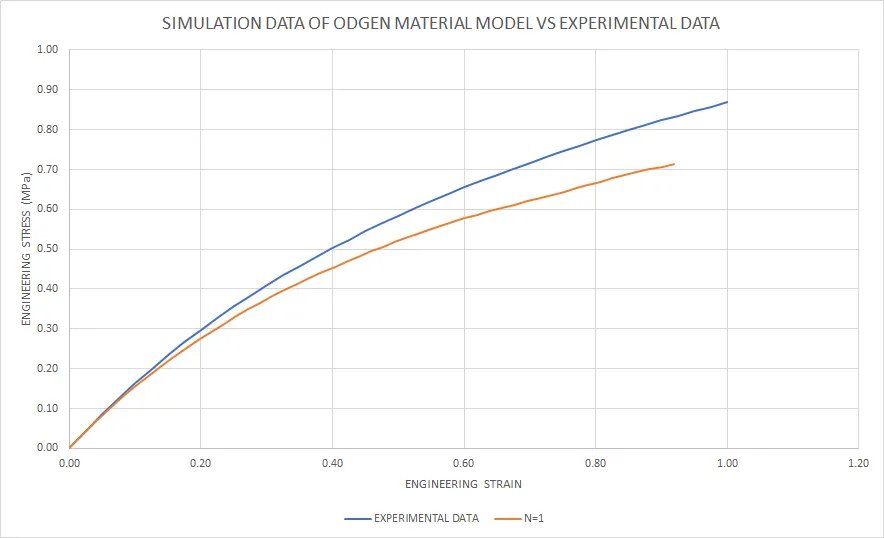
The plot compares the experimental stress-strain curve to the curve created by the odgen material model for N=1.
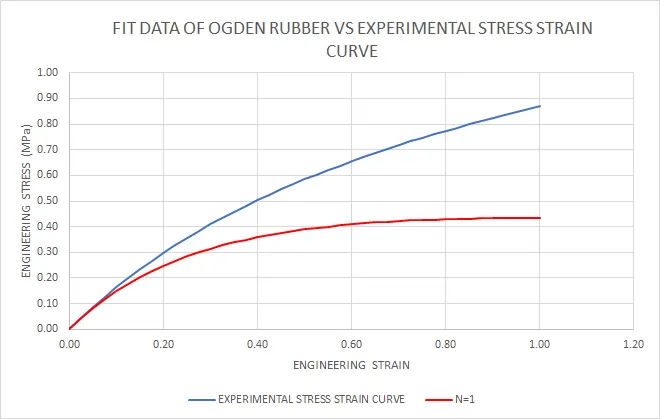
EFFECTIVE STRESS:
X-STRAIN:
The plot below compares the simulation results (stress vs strain) from the ODGEN hyperelastic material model to the experimental data. The true stress and true strain values from the simulation are converted to engineering stress and engineering strain.
CASE 5: ODGEN HYPERELASTIC MATERIAL MODEL AT N=3:
The constants are:
| mu(1)=-3.1842708827118E-05 | alpha(1)= 1.9262961070942E+00 |
| mu(2)= 2.6137539677282E-04 | alpha(2)= 1.5503244209897E+00 |
| mu(3)= 6.8199166677376E-04 | alpha(3)= 1.2887877441176E+00 |
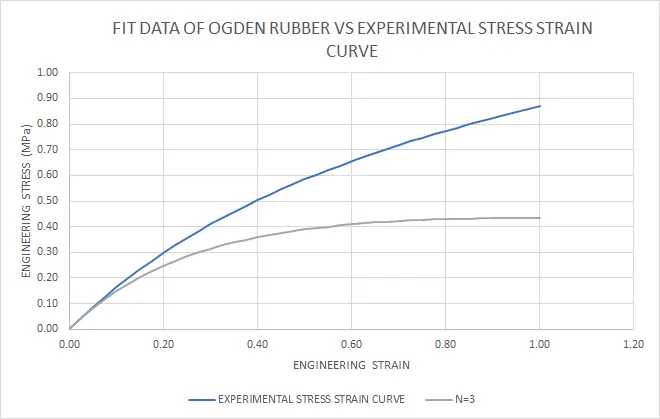
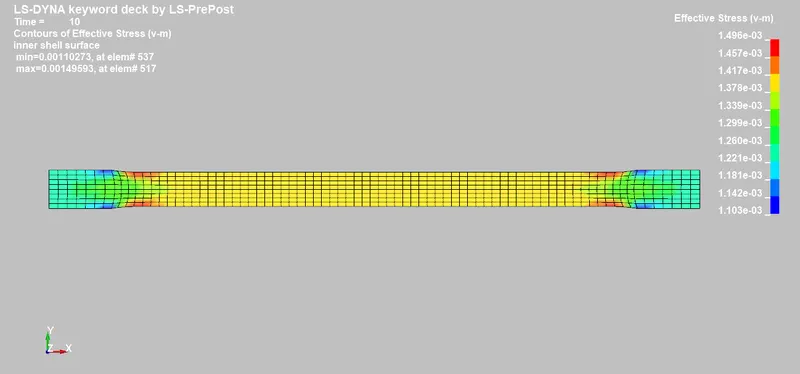
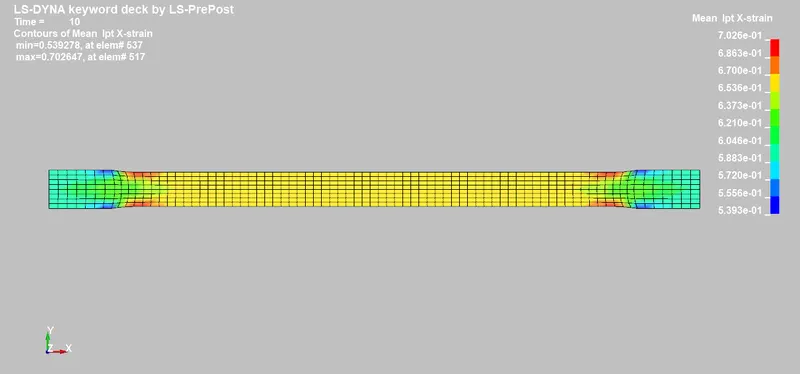
The plot compares the experimental stress-strain curve to the curve created by the odgen material model for N=3.
EFFECTIVE STRESS:
X-STRAIN:
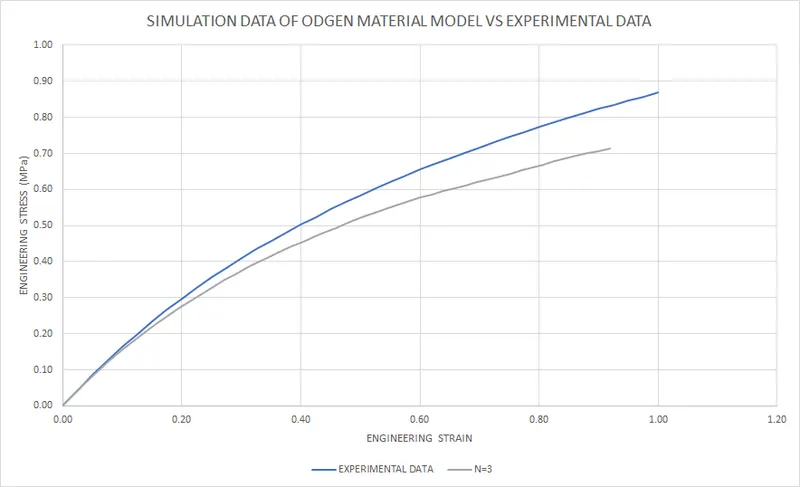
The plot below compares the simulation results (stress vs strain) from the ODGEN hyperelastic material model to the experimental data. The true stress and true strain values from the simulation are converted to engineering stress and engineering strain.
CASE 6: ODGEN HYPERELASTIC MATERIAL MODEL AT N=5:
The constants are:
| mu(1)= 4.0323436438621E-03 | alpha(1)= 7.2546609904936E-01 | |
| mu(2)= 5.6429592928523E-03 | alpha(2)=-7.6992712747797E-01 | |
| mu(3)=-2.0665647574958E-03 | alpha(3)=-2.2776263920694E+00 | |
| mu(4)= 7.2194437045284E-04 | alpha(4)=-3.8401867818613E+00 | |
| mu(5)=-1.3518292339874E-04 | alpha(5)=-5.2265081525242E+00 | |
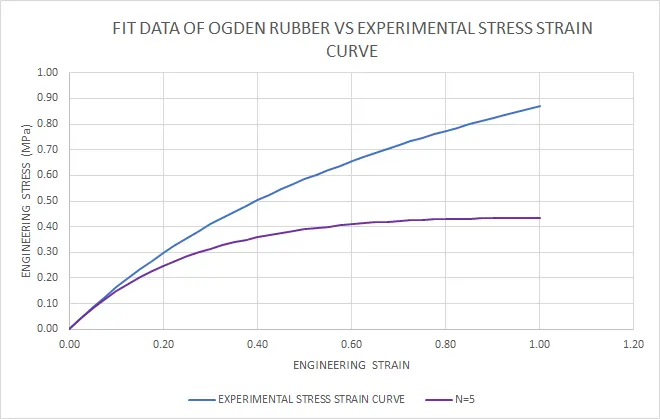
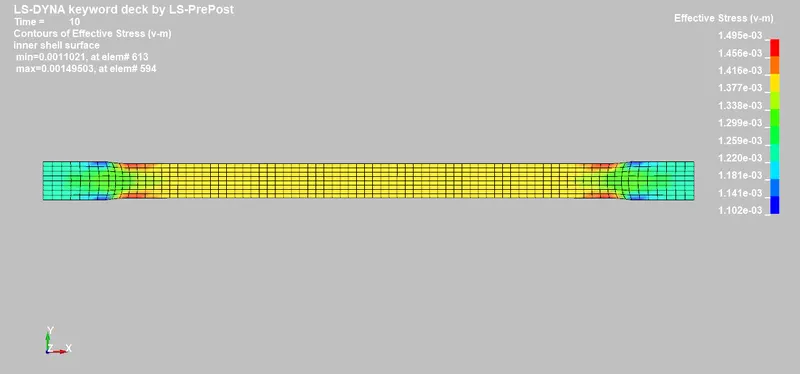
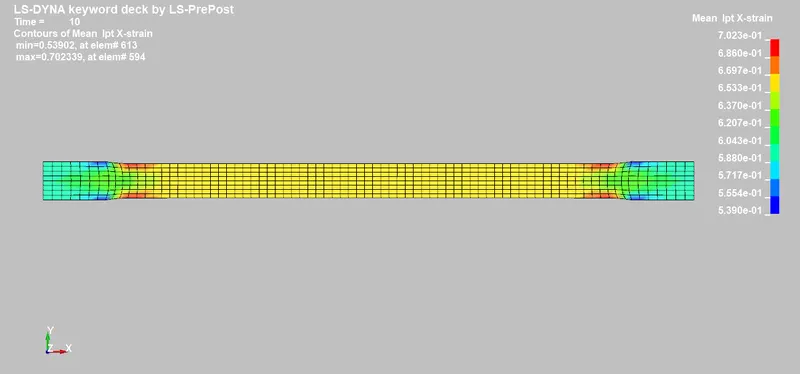
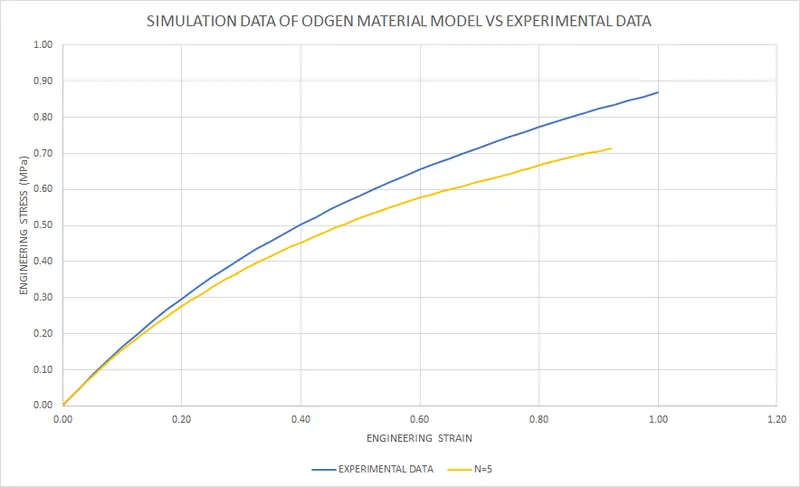
The plot compares the experimental stress-strain curve to the curve created by the odgen material model for N=6.
EFFECTIVE STRESS:
X-STRAIN:
The plot below compares the simulation results (stress vs strain) from the ODGEN hyperelastic material model to the experimental data. The true stress and true strain values from the simulation are converted to engineering stress and engineering strain.
COMPARISON BETWEEN N=1,3 AND 5 FOR ODGEN HYPERELASTIC MATERIAL MODELING:
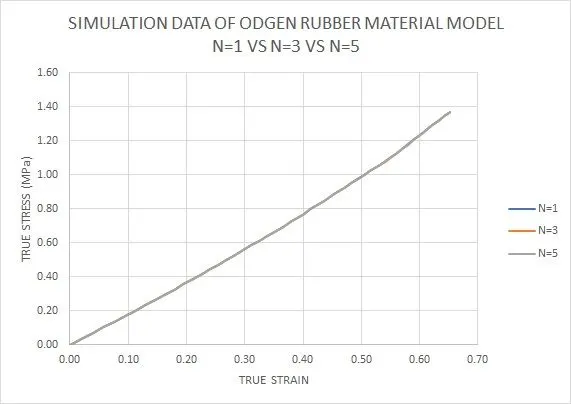
COMPARISON BETWEEN N=1,3 AND 5 FOR ODGEN HYPERELASTIC MATERIAL MODELING TO THE EXPERIMENTAL DATA:
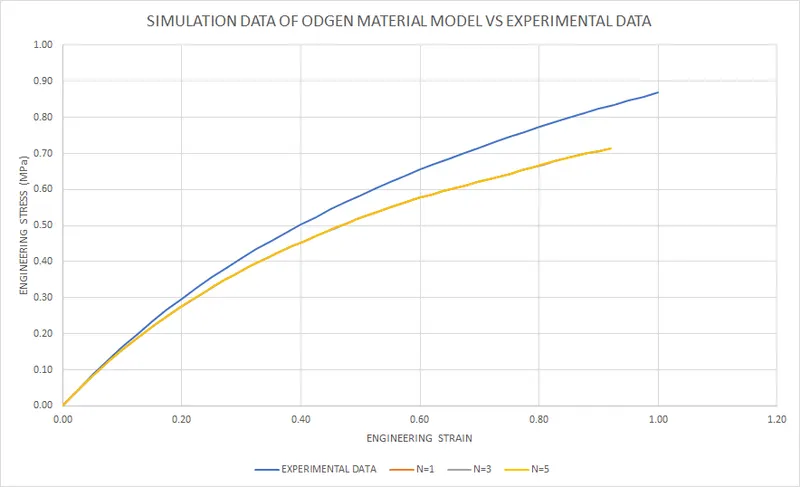
- It is clear from the d3hsp plot that the values of the stress and strain curve fit for different values of N are more or less the same. But, there is a large difference in the curve fit data (d3hsp file) and the experimental data.
- It is expected to have a better plot close to the input data with higher values of N.
- The difference in the results from the experimental and simulation data is due to the slight differences in the input material properties and the input displacement curve.
CONCLUSIONS:
- In a detailed comparison between the Mooney Rivlin and Odgen hyperelastic material model, it is clear that there is nothing much of a difference in the results from both the simulations. The results are more or less the same.
- But if we look at the curve fit data from the d3hsp file for odgen hyperelastic material model, we can clearly see a large difference between the experimental (input) data and the curve fit data.
- While the Mooney rivlin hyperelastic model gives more accurate or close curve fit for the input data, odgen material fails to keep up with the accuracy of the fit data.
- But the simulation data is close to the experimental data even for odgen material model.
- Here, the experimental data is very smooth and hence the results are more close to the actual data. But if we had a more noisy data, then in my opinion its better to go with the mooney rivlin material model with higher values for N.
- Moreover, the length of the specimen remained the same (289.9) for all the above cases.