Hyperelastic Material Modelling in LS Dyna
Aim
Using the given data find out the Mooney Rivlin and ogden constants and compare the material data from simulation and d3 hsp file to the actual given material data
Objective
In Ls Dyna we can define the hyperelastic material using Mat_77 material card which are the MAT_77_Hyperelastic_Rubber and MAT_77_o_ogden_Rubber Material cards .Hyperelastic material is easily representable in terms of stretch rather than using strain, as the strain is so high in these materials .A slight streaching is enough for this type of material to extend so much gives large amount of strain.Elastic modlus of these materials will be so small so that a slight streching is enough to give large strains.These materials are represented using the stretch and strain energy density.This is the more easier way than the stress vs strain representation in case of these materials.The consitutive eguations for these materials are strain enrgy functions which are derived by researches and some acceptable models we are using popularly such as YEOH , Arudha _Boyce etc..

By varying the Index values of i and j we can change the constitutive equations and use it appropriately for our component. Simillarly we will be having multiple coefficients , C. This changing of index will be basically changing the order of th polynomial of the energy density equation.This can be varying in LS dyna to get the appropriate strain energy density function for out material.
We need to find out the coeffcients of these material models and find out the best fit curve from the data from D3HSp file and compare it with the material curve.Then we need to simulate the dogbone model using the appropriate coefficients for which we get the best fit and then use the stress vs strain curve from that simulation to compare with the material curve and arrive at the conclusion
Procedure
As usual we will be starting with the lab data we are provided .We will be plotting the curve using those dta and we find out that the data is having noise in it.So we need to fit that curve.This is done using the MS Exel and The fitted curve equation is used to define the stress values at the strain points which are equidistant from one another.We collected such 40 and above number of points and plot it using excel.This fitted material curve data is used to be define in the Ls Dyna .
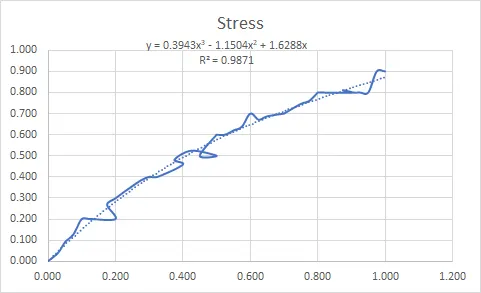
Curve Fitting of material Data
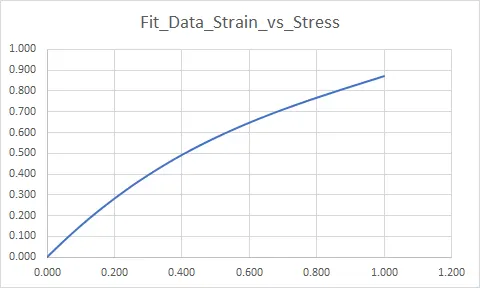
Fitted Curve
First we will be importing the dogbone specimen into the Ls PrePost and then we will be proceeding to deck setup.
Deck Setup
This setup is for some tensile test.The material used here is hyperelastic material.This leads to high amount of deformation.This high deformation leads to Non linerity in the simulation.And we will be caring only about the simulation in which the inertial effects are nill.Since in tensile test specimen is loaded gradyually and the deformation ha[peens slowly,so the inertial effects are negligible.So we can go with the IMPLICIT solving method.
After the import of the model.We need to define the material .For that we can use DEFINE_CURVE card and we can input the .csv file which we earlier prepared with the material curve fitted data and we will be using MAT_77 Hyperelastic_Rubber card .We set the N value as 1 and we define curve in LCID which is the load curve ID.Since we are inputting the engineering stress and engineering strain values we will be setting the specimen Guage length,Width,Thickness as which indicates there is no change in the area of cross section of the specimen,Which basically tells the solver that the data we are using the Engineering Stress vs strain data.Then basic details such as density and Poisson's Ratio is needed.In poisson's ratio we will be inputting the value as 0.4995 ,basically the poisson ratio iof these type of material vary from 0.49 to0.4999.Igf we give 0.5 itself there may be numerically instability may cause.So we define these values in card.
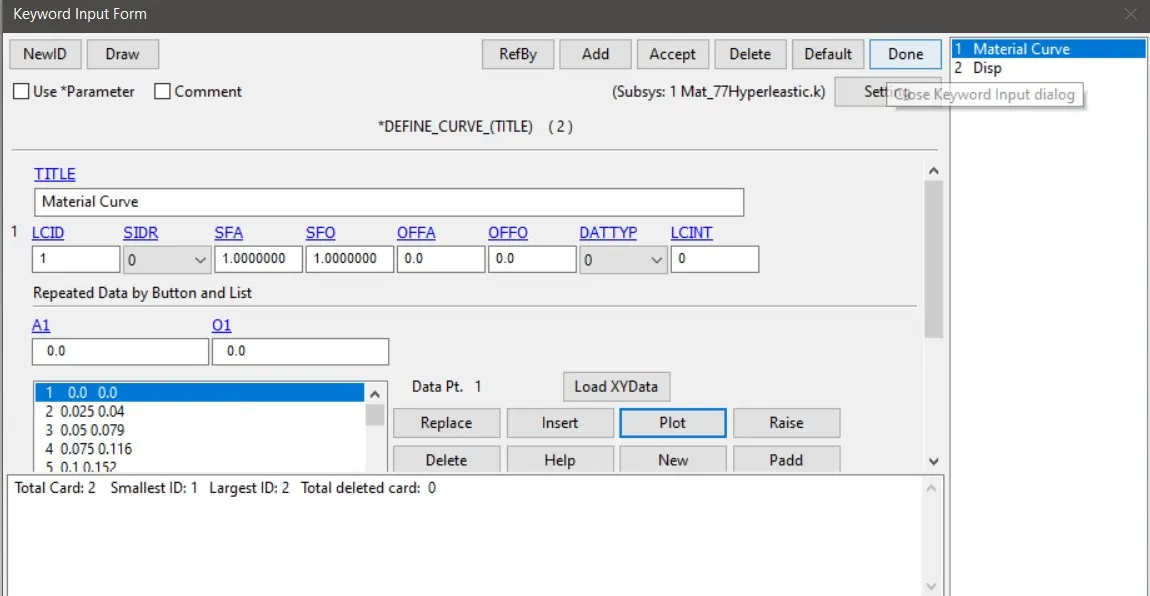
Define _ Curve card
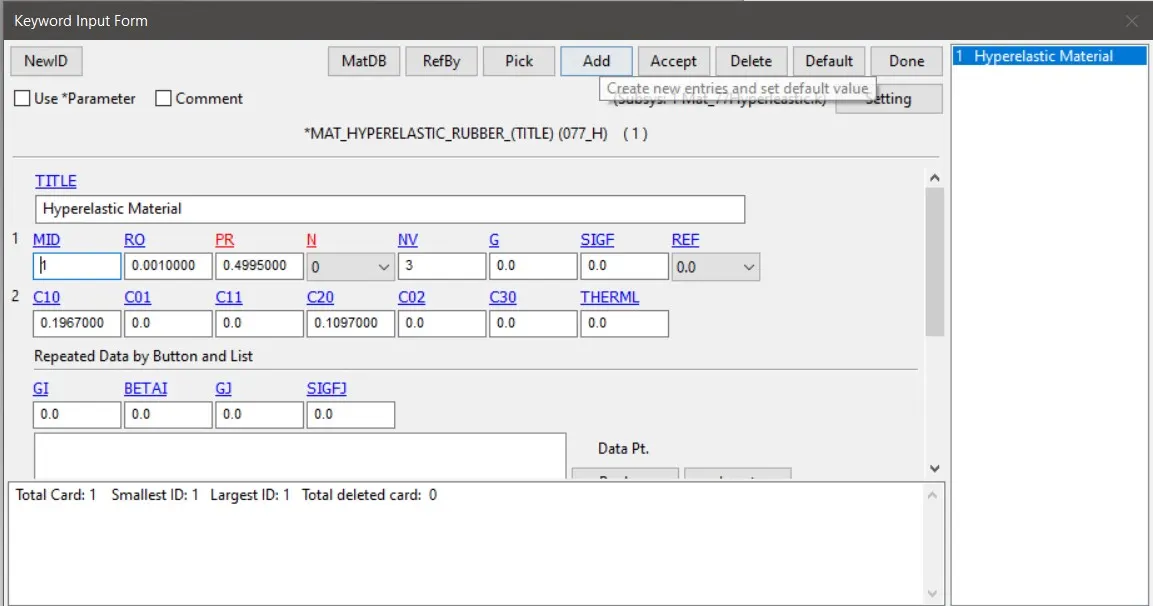
Mat_77_Hyperelastic_rubber card
Boundary Condition Setup
In one side we will be restricting the middle node in all degrees of freedom,while the other nodes in that region will be restricted in all other directions expect the direction in which the tensile specimen will contacts wghile it is streached.Then on the other sides make a node set of all the nodes in that region and we will be definig the Prescribed_Motion_set and we define those nodes in that card.For curve in the define curve card we define another curve which defines the displacement.But here it is asked to have the strain value till 100%.So we need to have the displacemnet same as the length of the specimen.Here the specimen length is 145 mm.So we need to have the displacement also as the 145mm.Then we agian define that curve in Prescribed _motion_set card.
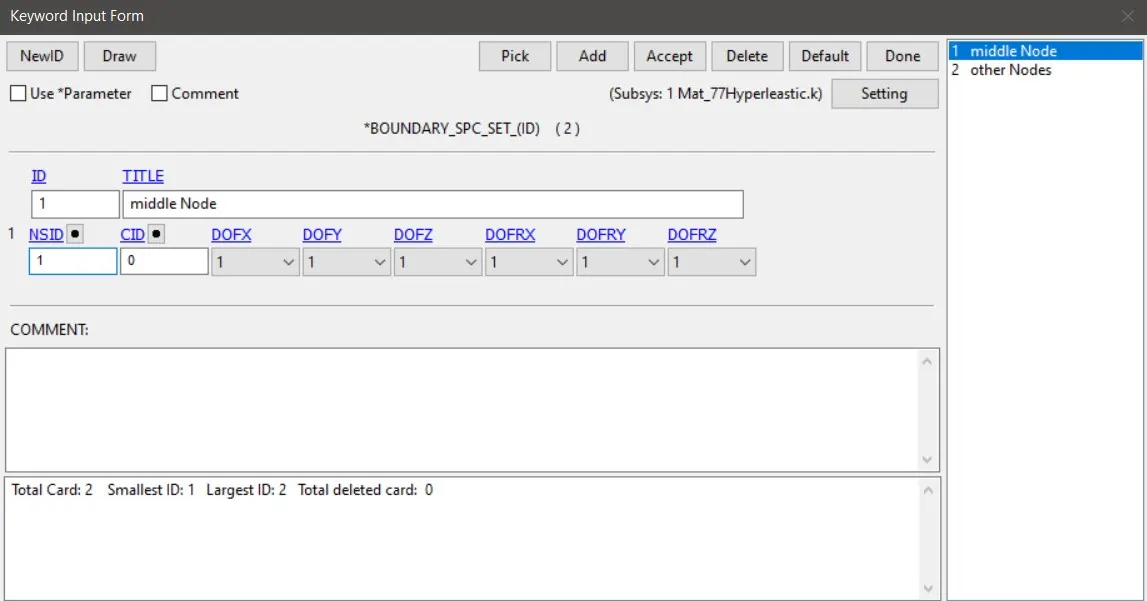
BOUNDARY_SPC CARD
Then the basic cards can be defione like control_termination,Database_D3Plot .In addition to it Database_Extent_Binary card to get the strain values from the simulation.Since this is an implicit analysis we need to define the IMPLICIT GENERAL card and IMPLICIT AUTO card.In implicict general card we define the IMFLAG as 1 to do the implicit analysis.And in IMPLICIT AUTO carad we define IAUTo as 1 to get automatic timestep to ensure the stability of the simulation.And also we define the Minimum and maximum timestep sizes in it.
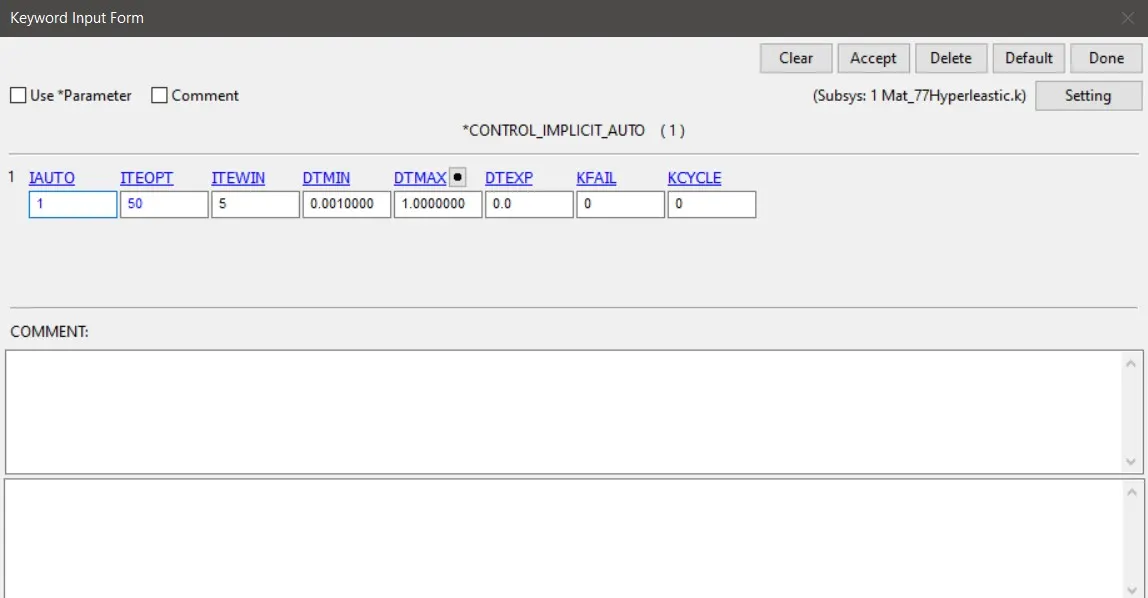
CONTROL_IMPLICIT CARD
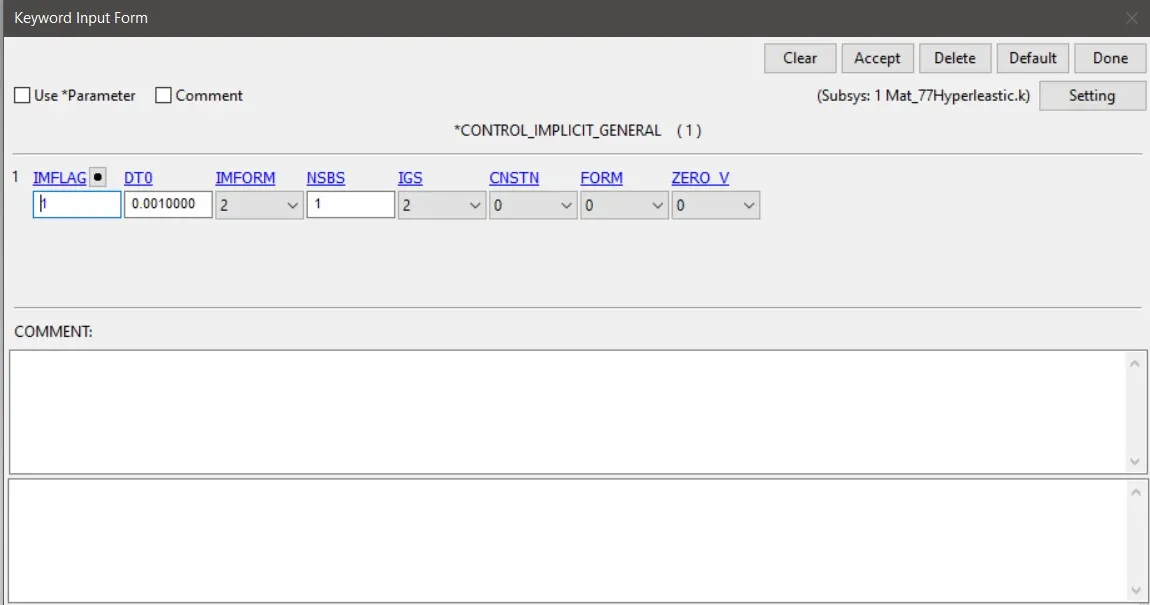
Control_Implicict_General Card
We run this deck in Ls Dyna Program Manager with the memory as 1000M and dual precision solver.The run once starts to solves we can quit it if we wanted or let it run entirely.then open the d3hsp file and from that we can find the Mooney constants C10 and C20 in it .We can copy that to excel.then we can find out the fitted curve data which fits by Ls dyna itself in d3HSP file itself .But the data is availabel in terms of extension and true stress.Copy those and paste in excel.We need to convert the extension to Engineering strain, as
Extension = 1 + Engineering Strain.
The stress we get from the d3hsp file is true stress we need to convert that to engineering stress.This is done by the equation,
True stress = Engineering Stress (1+ Engineering strain)
So we can get the enginering stress and strain and we can plot using these data the curve of engg strain vs engg stress in excel.
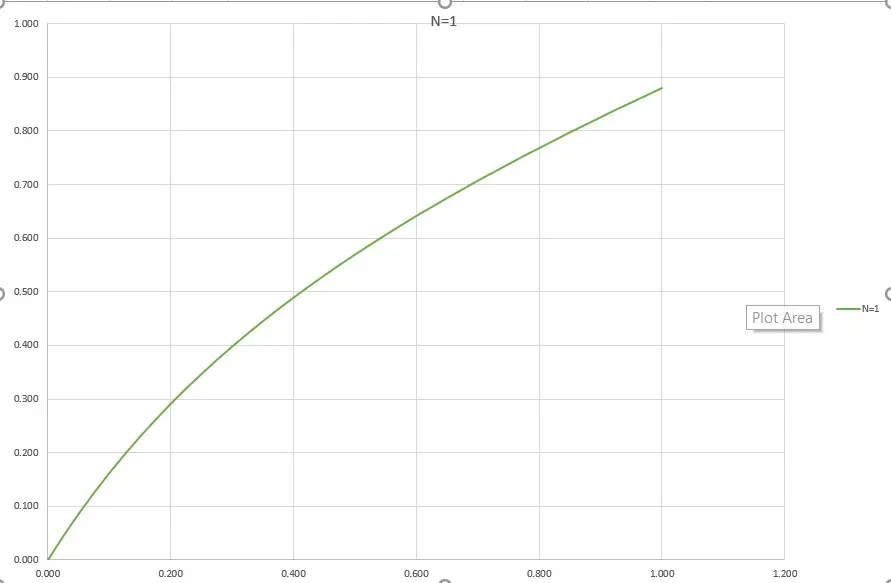
Fitted Curve when running the simulation with N= 1
Similarly we need to set the N value as 2 in material card.And find out the C10,C01,C11,C20,C02 from the hsp file and we need to repeat the same steps and fit the curve in excel .Similarly done for N = 3 also.
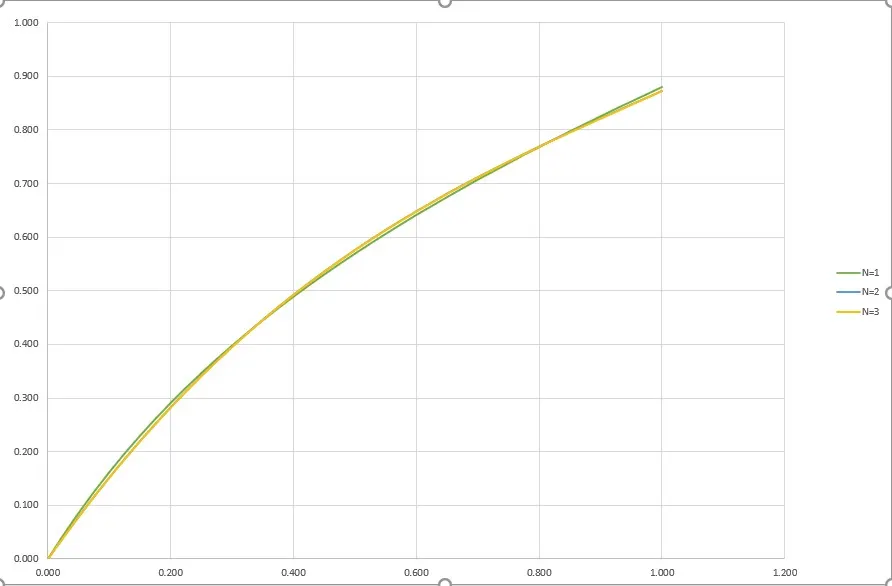
Comparison of Fitted Curves with all N values
Then we need to run the simulation with each N values ranging from 1 to 3 .Then from each simulation we need to extract the Stress vs Strain curve from the binary plot.Then we can copy those data of that stress vs strain curve .We can paste those in excel and compare it with the Material curve.This same thing needed to be done for every N values.Then make the necessary conclusion.If an N value better fit with the material curve we can choose than N value.So we can input the hyperelastic material constants of that N value and we can input that into the hyperelastic material card.That will be the material card for us.
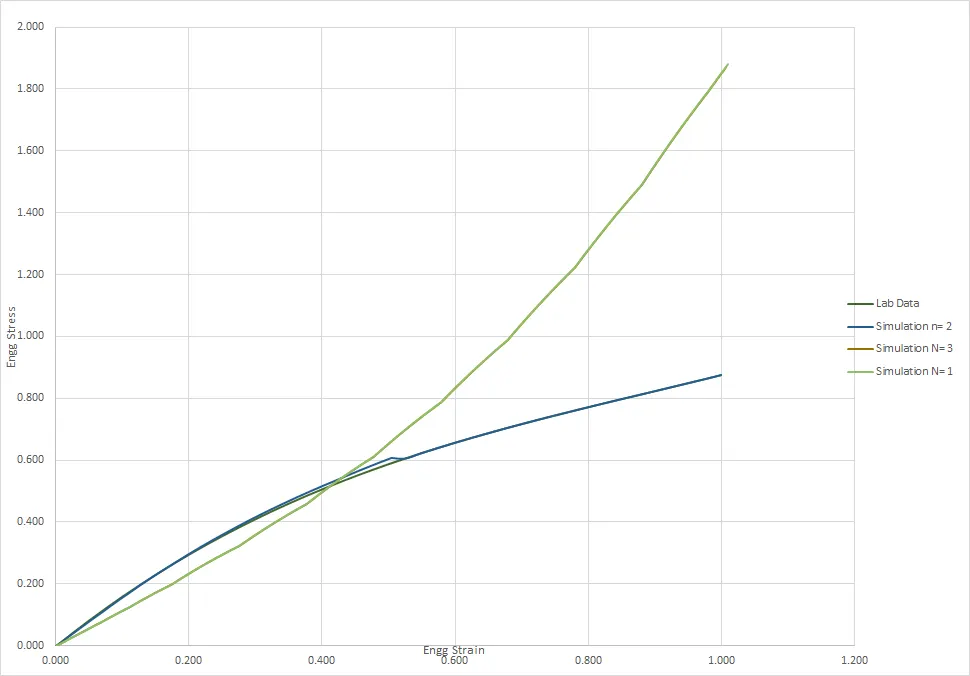
Comparing curves from simulation with material curve
The above all steps needs to be done using the MAT_77 OGDEN material model also.But here we have the ogden material constants as µ and α.We get differant values for those two when we change the N values from 1 to 3 .Then once we fit the curve, we run the simulation with the the N set to zero and input values of constants as we get using varying N values.Then again repeat the same steps as we used in hyperelastic material model.
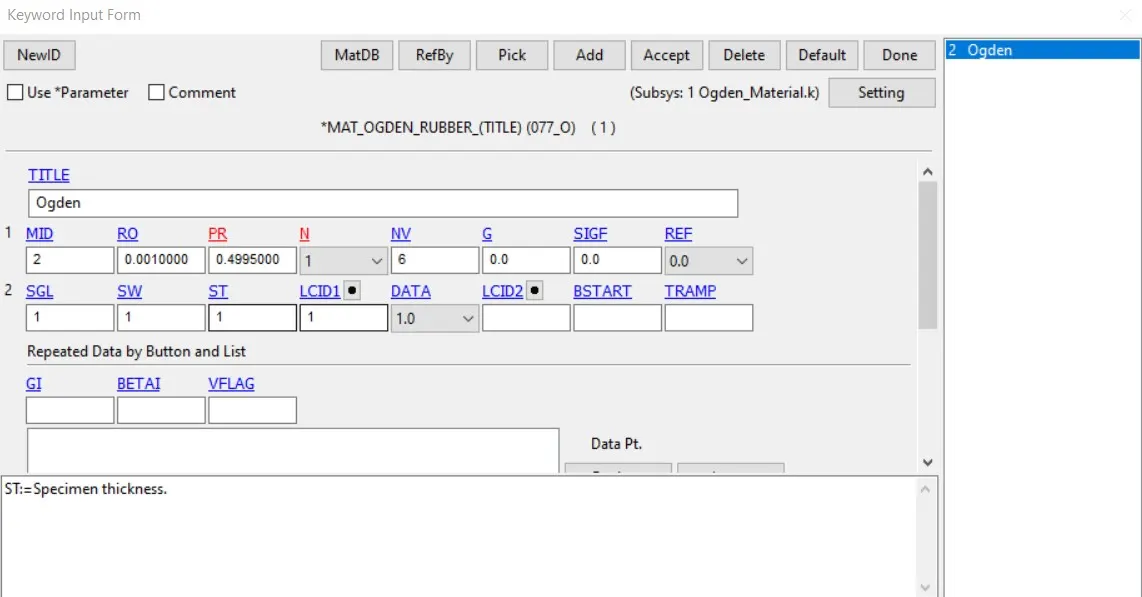
MAT_77 Ogden material card
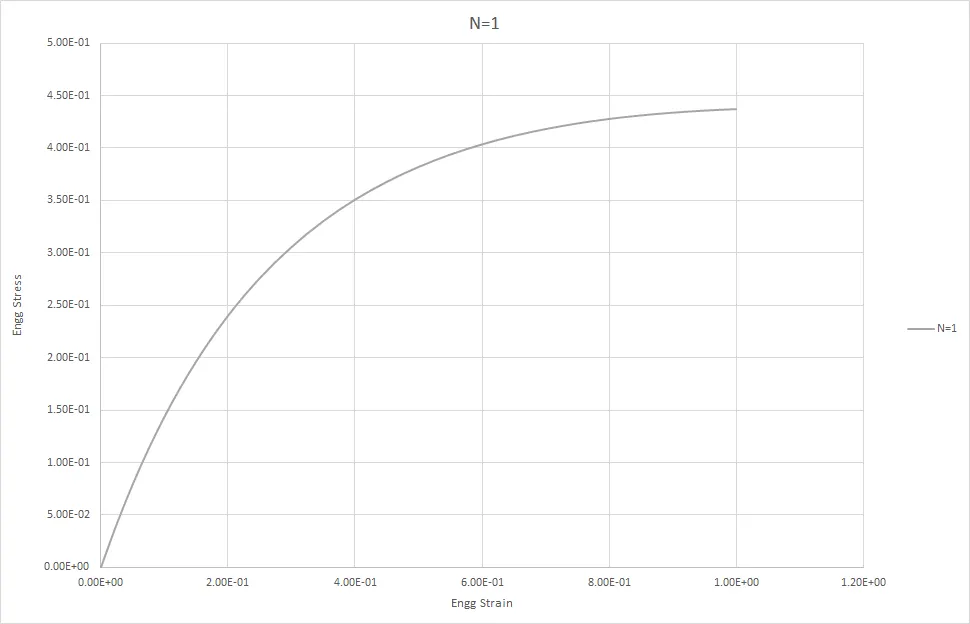
Fitted Curve with N =1 (Ogden )
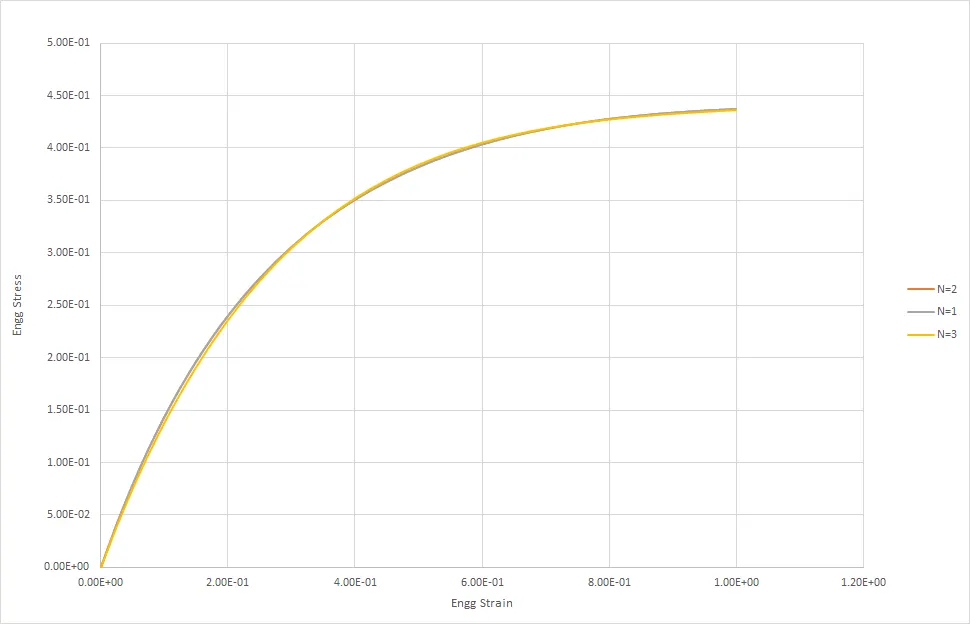
Fitted curve comparison with all N values (Ogden )
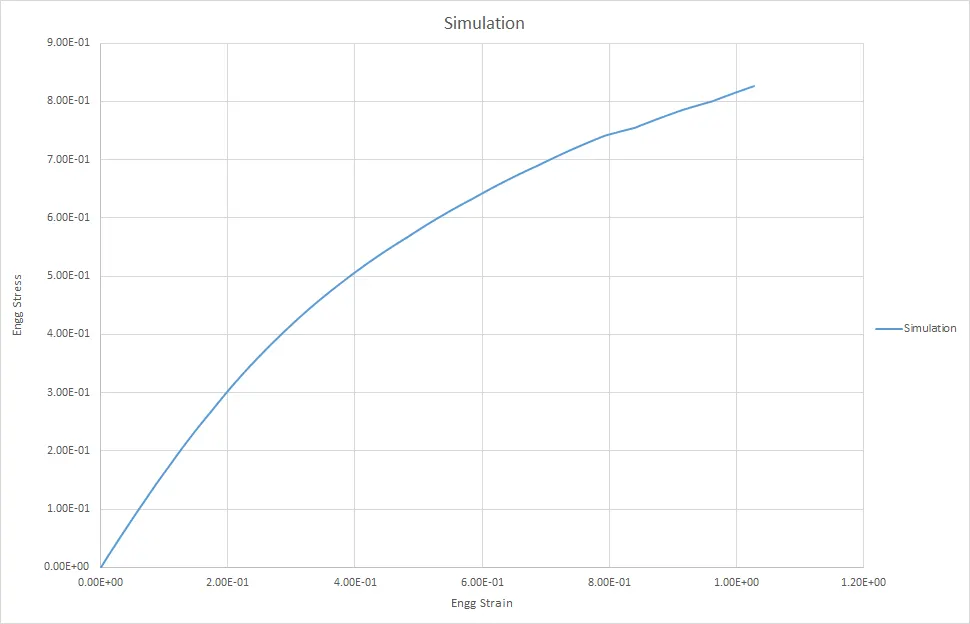
Stress vs strain curve frorm simulation for N = 2 (Ogden )
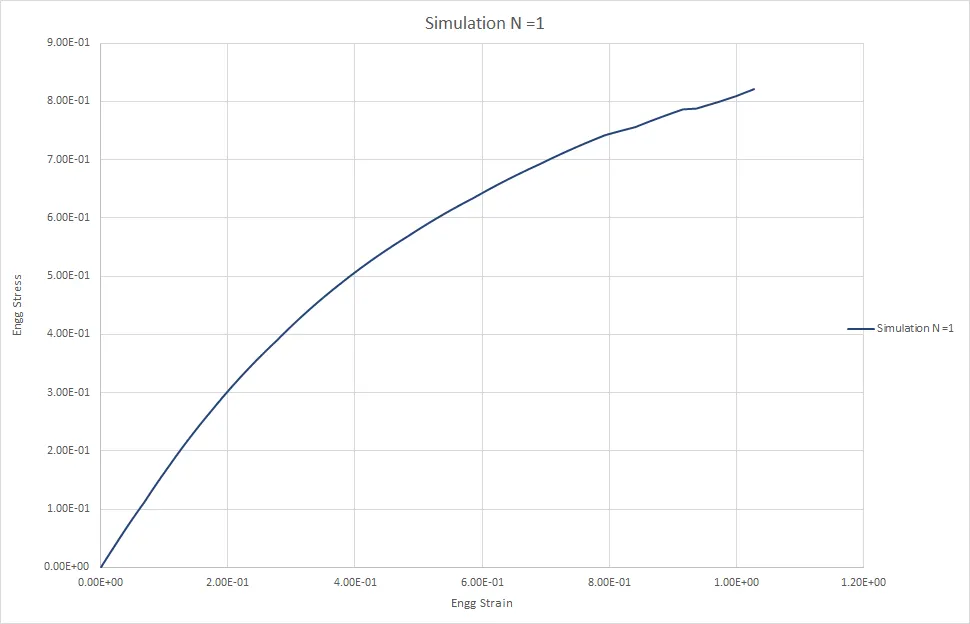
Stress vs strain curve frorm simulation for N = 1 (Ogden )
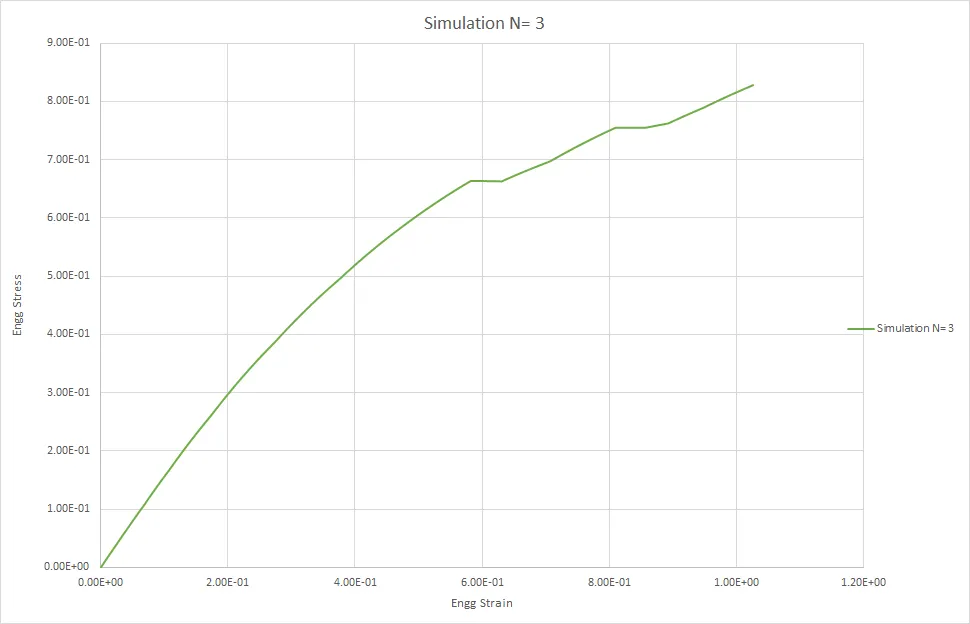
Stress vs strain curve frorm simulation for N = 3 (Ogden )
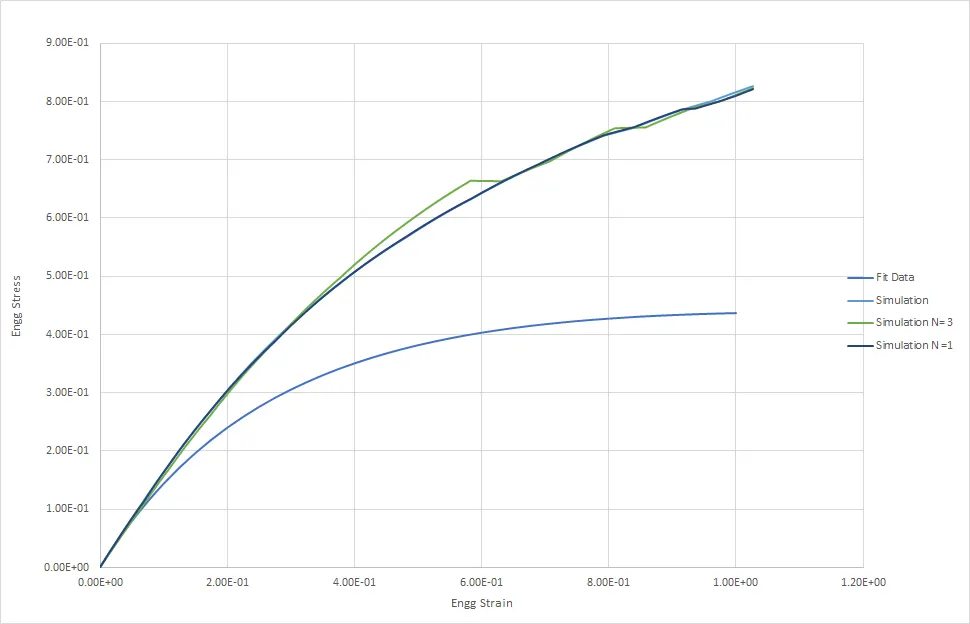
Comparison of Stress vs strain curve from simulation for all N values with Material curve (Ogden )
Conclusion
We can see that the in hyperelastic matrial model with N = 3 ,the simulation data and the material curve closely matched .But for the other N values the strain enrgy density equation is not providing the results which matches with the material curve.But ks dyna had done the great job in fitting the curve in evry N value.But as we run the simulation and extract the stress -strain data the results doesn't matches with the material curve.So we can took N = 3 for defining the matrial card and w can choose the hy[perelastic constants that we got for N = 3 , to define the hyper elastic card.
While in case of Ogden material is curves have shown no match with the material curve after a stres value of 1 x 10^-1 fo all the N values.but all the 3 N value curves are matching some what.But the curves doesn't match with the material curve.So we cannot use that material constants and that material card as the strain density equation is not suitable for defining this material data.So we must use the hyperelastic material card with N = 3.