Week 10 : Fuel Consumption rate (DHEV)
Q1) Calculate fuel consumption rate for a given vehicle operating condition for all feasible gears. Select the gear that results in the lowest fuel consumption.

To calculate fuel consumption rate from engine operating condition, use Engine data provided (Engine_data_1_9L_Saturn_95kW.mat). Use “interp2” function in Matlab to find the fuel consumption value from the 2d map data provided.
Plot the operating points on the engine map in Matlab (as shown in the lecture).
Answer:
close all
clear all
clc

% Given
Pw = 35;
Vveh = 90;
Rw = 0.35;
Gear = [1 2 3 4];
rho = [3.06 1.62 1 0.7];
Mu_t = [0.9 0.9 0.9 0.9];
rho_f = 3.73;
[X,Y] = meshgrid(Gear,Mu_t);
V = interp2(X,Y,'cubic');

% Calculation :
omega_w = Vveh/Rw;
%Pw = Tw + omega_w;
Tw = Pw - omega_w;

for i = 1:length (Gear)
    Pe(i) = Pw/Mu_t(i);
    omega_e(i) = omega_w*rho_f*rho(i);
    Te(i) = Pe(i)/omega_e(i);
end
figure
surf(omega_e,Te,V);
title('Week 10')
xlabel('Speed in rpm')
zlabel('Gear')
Explain :
Where the values of Pw, Vveh, Rw, rho, Gear, Mu_t, rho_f and Data are Give in the Question.
Then we are calculting the Values of the omega_w using Vveh and Rw values .
After that calculating Tw value using Pw minus omega_w values.
There after for loop is used to find Pw and Mu_t values to calculate Pe.
then using omega_w, rho_f and rho values to find omeg_e value.
Te is calculated by using Pe and omega_e value.
then Calculated values are plotted.
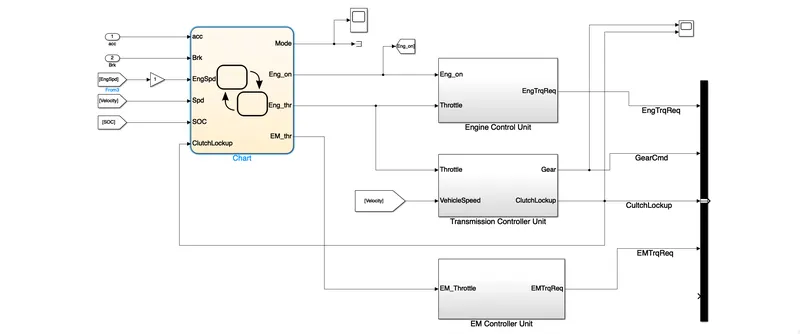
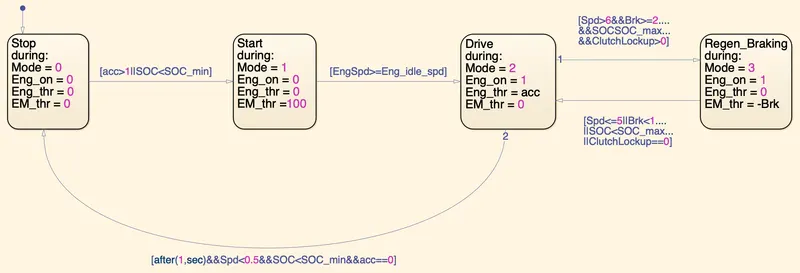
Q2. Create a Simulink Stateflow chart similar to the one shown in the lecture. This Stateflow is used to represent the function of the Supervisory Controller. This will be used in the final project