Week 1 Stress Concentration on a Plate with hole
AIM: - DESIGN A PLATE WITH A HOLE AND DETERMINE THE MAXIMUM DEFORMATION AND STRESS DEVELOPED IN THE MODEL
MODEL 1: PLATE WITH ONE CENTRAL HOLE.
MODEL 2: PLATE WITH THREE HOLES.
OBJECTIVES:
Compare the deformation and maximum stress developed in both models.
From an analysis standpoint, select the better design.
From a manufacturing standpoint, select the better design.
MODEL 1: PLATE WITH ONE HOLE:
The 2D model for the plate with a hole I center is shown below:
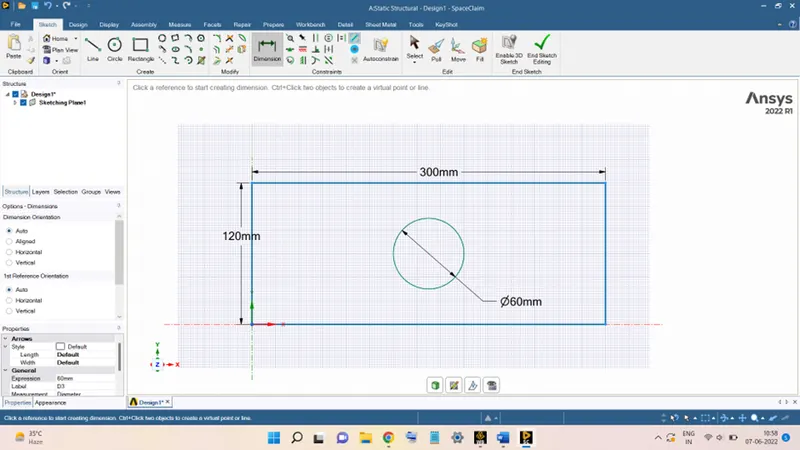
This 2D sketch will be converted into the 3D plate with the help of the Pull command and giving the thickness equal to 30 mm, the 3D model of the plate will be ready and will look as shown in the figure below:
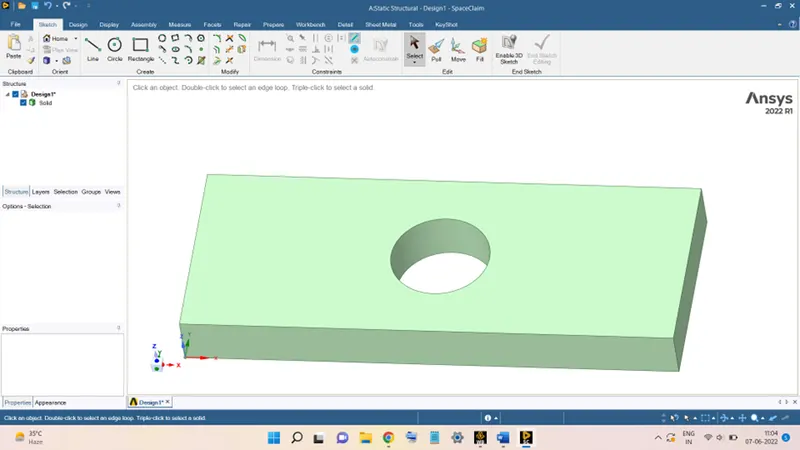
After successfully creating the model close the SpaceClaim and right-click on the ‘Model’ option and select the ‘Update’ option to update the model.
After this, double-click on the Model option the start the Mechanical Tool.
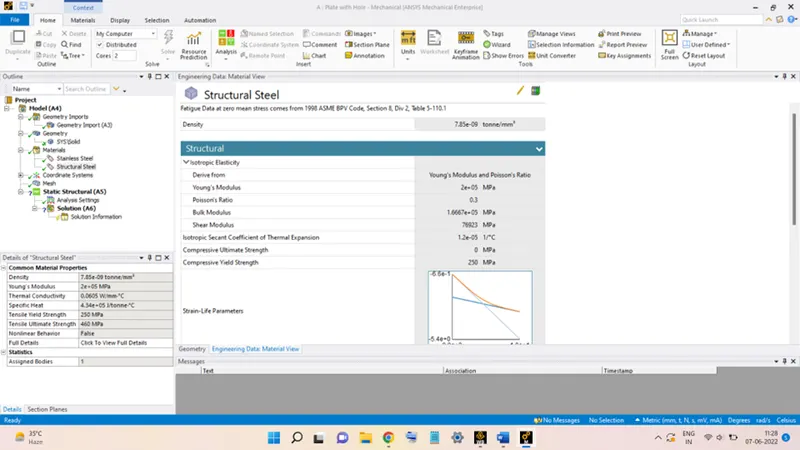
In the Mechanical tool, the material properties applied to the model are Structural Steel, as shown below:
After applying the material to the model, the next step is to mesh the model. To do so, click on the ‘Mesh’ icon and set the ‘Element Size’ equal to 3mm. now, right-click and select the option ‘Generate Mesh’ to create a mesh.
The mesh obtained through this will be made up of Hexahedron elements. As shown below:
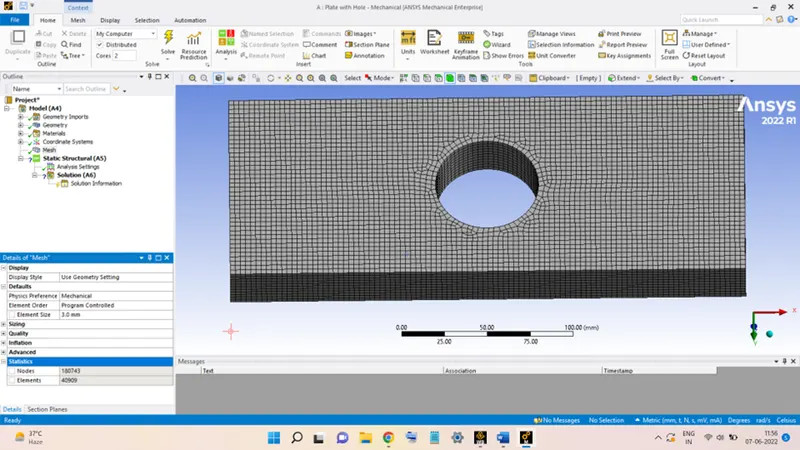
The total number of Nodes and Elements in the mesh are also shown in the above figure.
However, the mesh required is a Tetrahedron mesh, to do so, right-click on ‘Mesh’, go to the ‘Insert’ option and then select ‘Method’.
Then, click on the ‘Scoping Method’ and select the model. Go to the ‘Geometry’ option and click ‘Apply’.
Now, click on ‘Method’ and then select the ‘Tetrahedrons’. After this, right-click and select ‘Generate Mesh’. the mesh obtained is shown below:
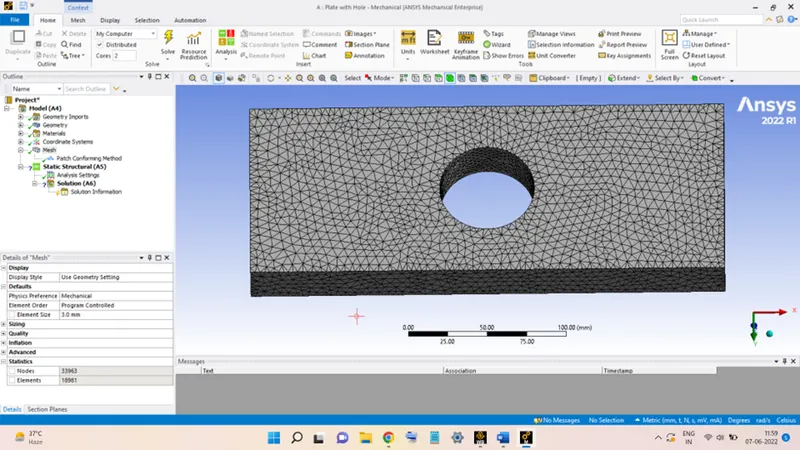
It can be seen, that the number of nodes and elements for the tetrahedron mesh is very less compared to the hexahedron mesh.
The mesh quality is shown in the figure shown below:
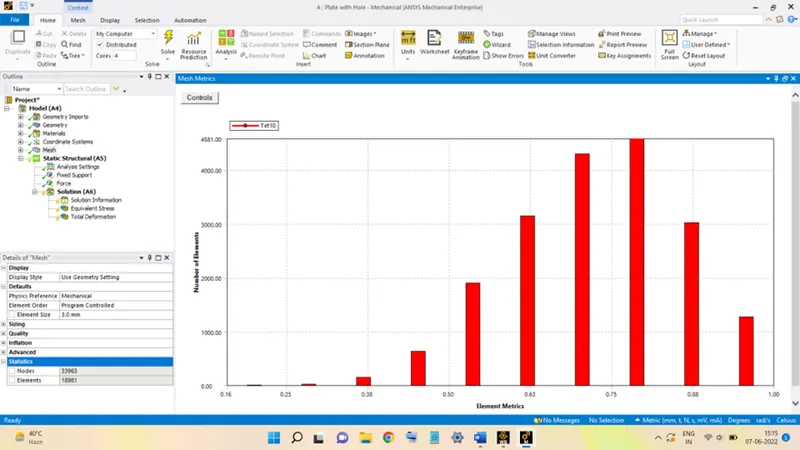
Now the next step is to set up the analysis, this is done by applying the appropriate Boundary Conditions and Loading Conditions on the model.
In the given problem, the left face of the plate is fixed. In the model, this is achieved by right-clicking on ‘Analysis Settings’, go to ‘Insert’, and choose ‘Fixed Support’.
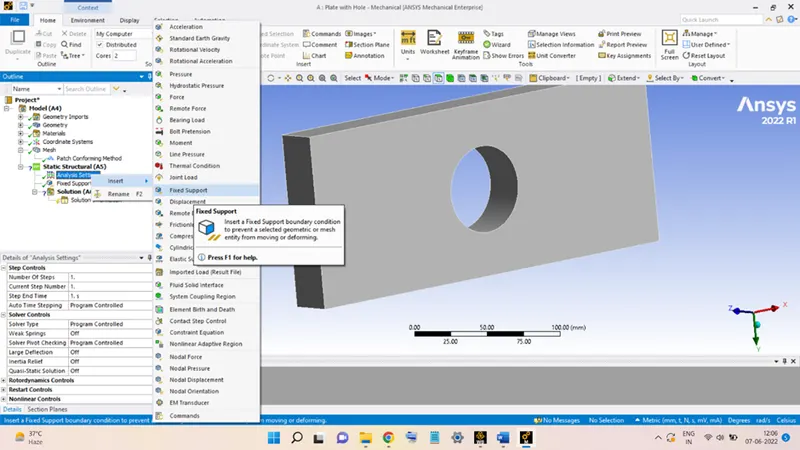
Then, click on the left face of the model and then go to the Geometry option and click ‘Apply’. The model will look like this:
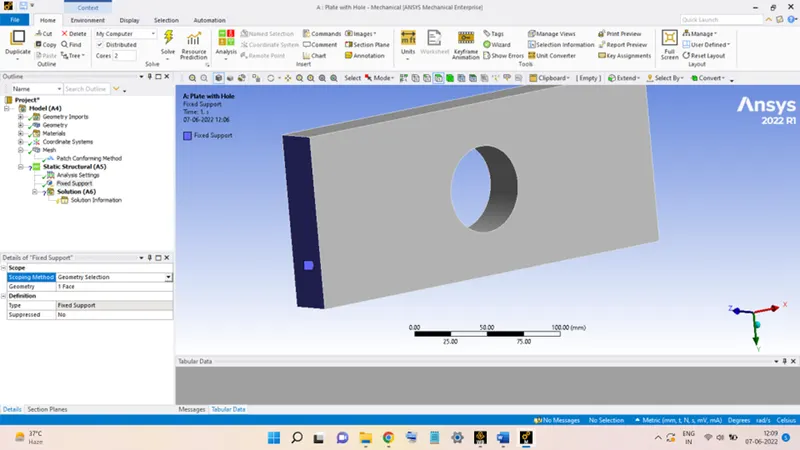
The plate is subjected to a tensile load of 500 N acting on the right face. This is added by right-clicking on ‘Analysis Settings’, going to ‘Insert’, and selecting the ‘Force’ option. Then, select the right face and go to ‘Geometry’ and click ‘Apply’.
Now, go to the ‘Definition’ section, click on ‘Define By’ and select ‘Components’. Now, enter the magnitude along with the direction of the force in the ‘X Component’. Since the force is acting in the positive X-direction.
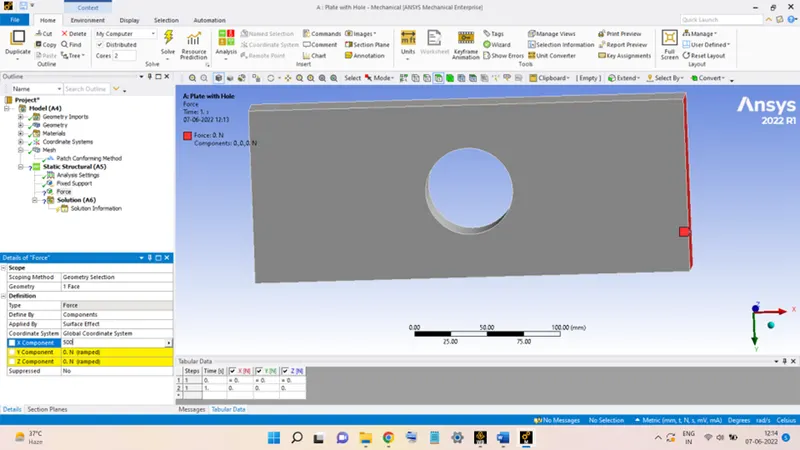
With this, the model is now ready for analysis. The only thing left to do is to add the results options which are of importance after the completion of the analysis.
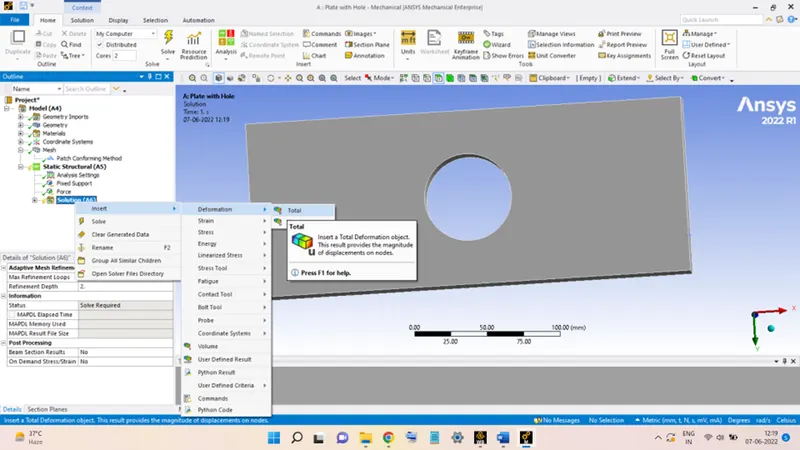
For this problem, only the Deformation and Stresses produced are the only quantities which are needed. To add them, first, right-click on ‘Solution’, go to ‘Insert’ and then go to ‘Deformation’ and select the ‘Total’ option.
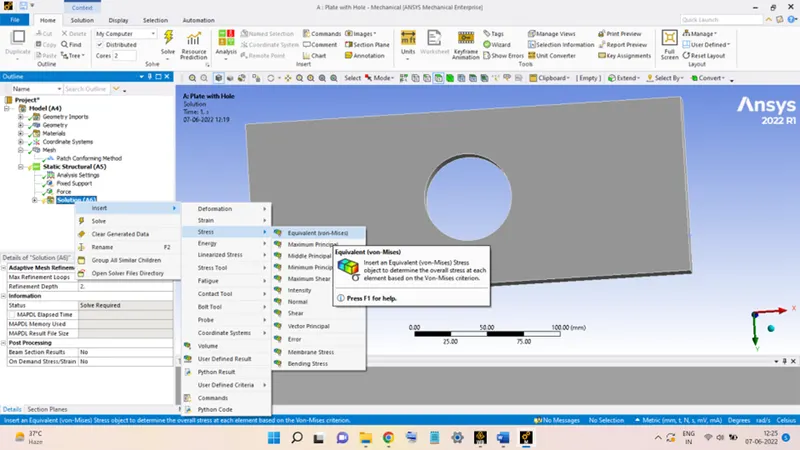
Similarly, for the stress repeat the process again, and instead of going to deformation go to Stress and select ‘Equivalent (von-mises)’
After this, click on the ‘Solve’ button to start the analysis.
RESULTS
After successful completion of the analysis the results obtained are as follows:
1. Equivalent Stress:
The distribution of the stress throughout the plate is shown in the figure below:
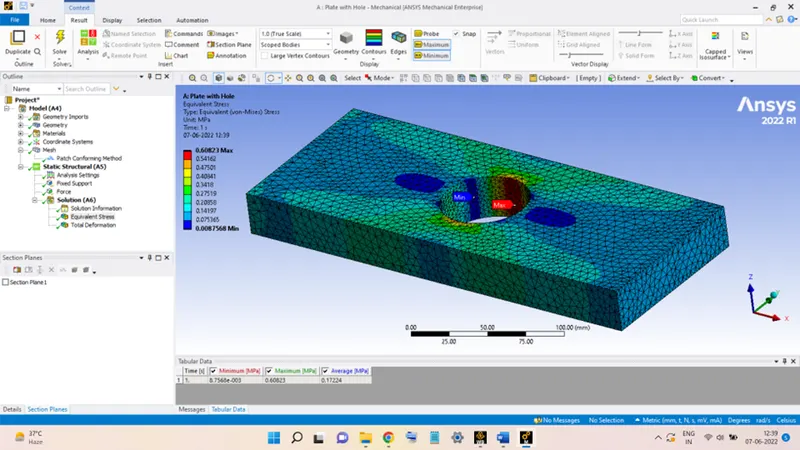
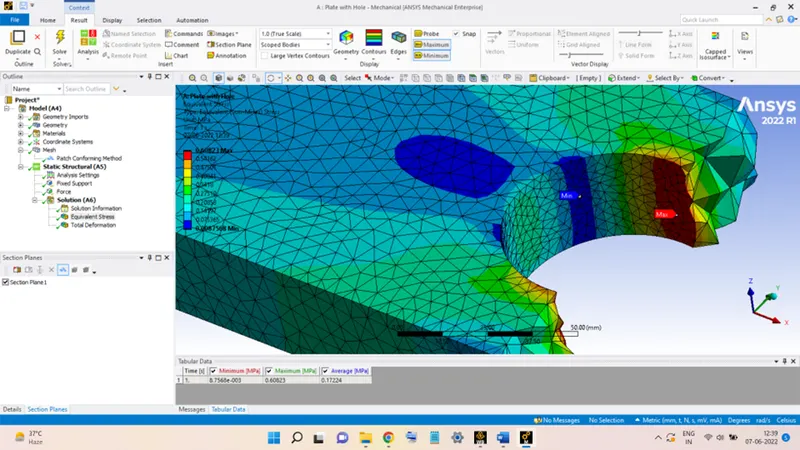
From the above two figures, it is observed that:
1. The stress near the hole is more than the induced in the plate far from the hole. This is due to the phenomenon of stress concentration.
2. The maximum stress obtained is equal to 0.6082 MPa at a location shown by the Probe named Max in red colour.
2. Total Deformation:
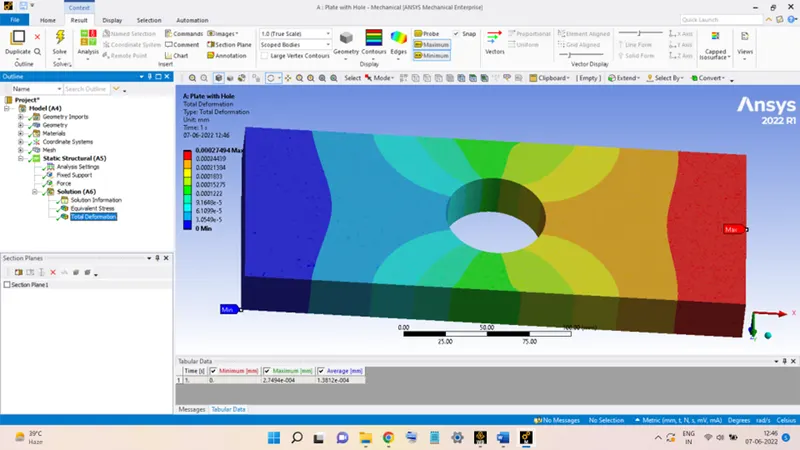
The deformation of the plate due to the loading is shown in the figure below:
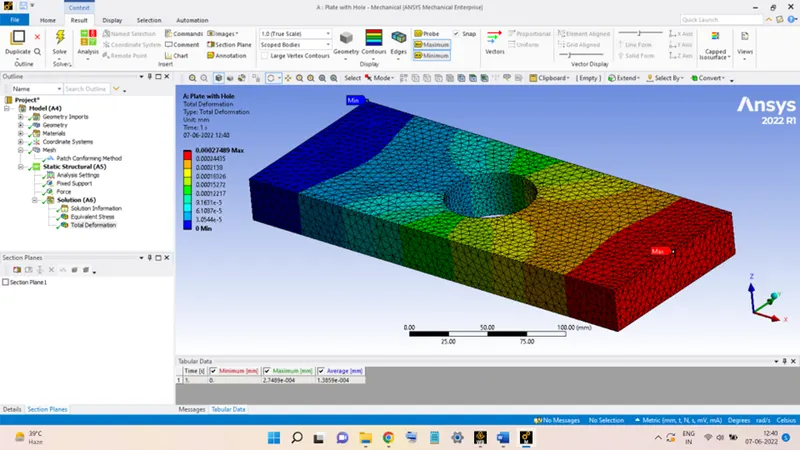
The plate is seen to have maximum deformation in the elements near the free face (right face) and the minimum deformation at the fixed face of the plate.
The maximum deformation is equal to 2.7489 x 10⁻⁴ mm.
Refined mesh results:
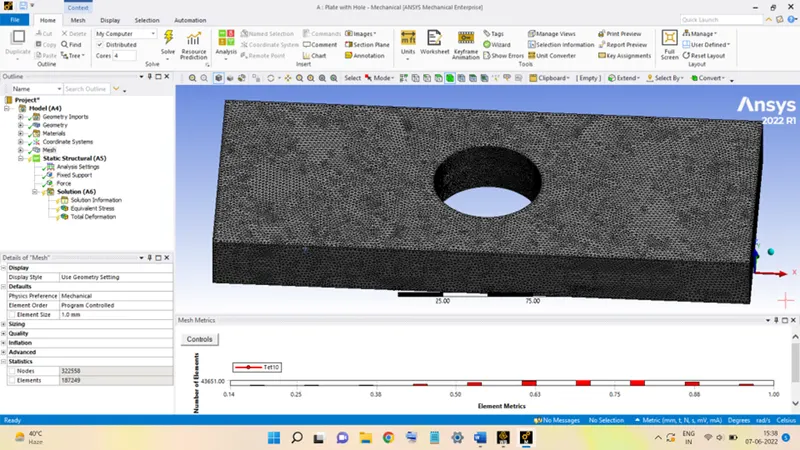
The above results are obtained taking the element size equal to 3 mm. Now the mesh element size is reduced to 1 mm and the model is again solved. The model with the 1 mm element mesh is shown below:
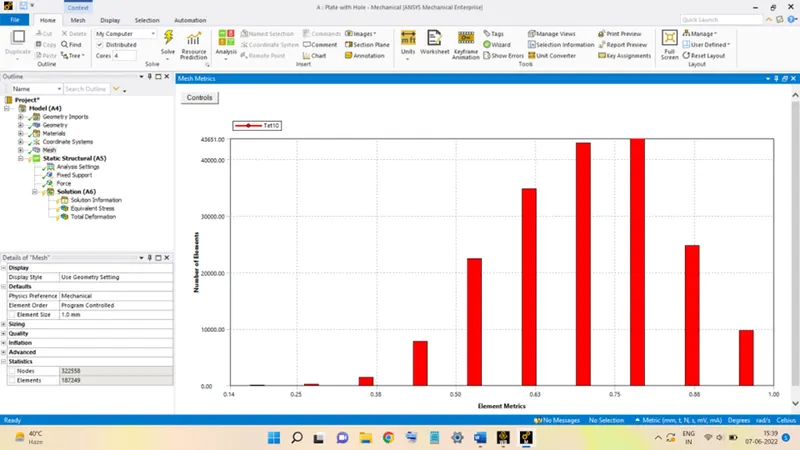
The mesh quality can be seen in the figure below:
On solving the model, the results obtained are as follows:
Equivalent Stress:
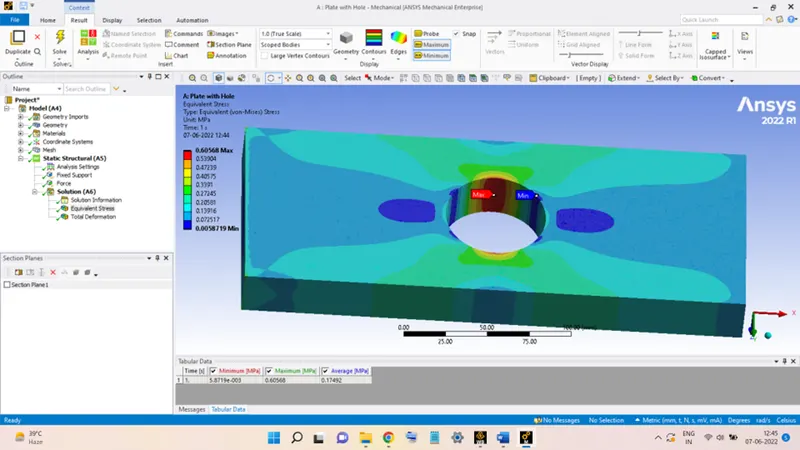
The maximum stress induced in the plate is equal to 0.6056 MPa shown by the probe in the above figure.
Total Deformation:
The maximum deformation is equal to 2.7494 x 10⁻⁴ mm as shown in the figure below:
MODEL 2: PLATE WITH THREE HOLES:
The 2D model for the plate is shown below:
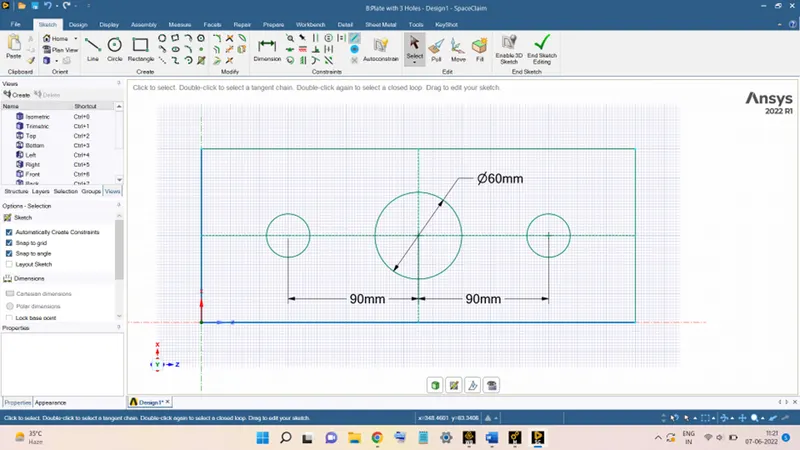
This 2D sketch will be converted into the 3D plate with the help of the Pull command and giving the thickness equal to 30 mm, the 3D model of the plate will be ready and will look as shown in the figure below:
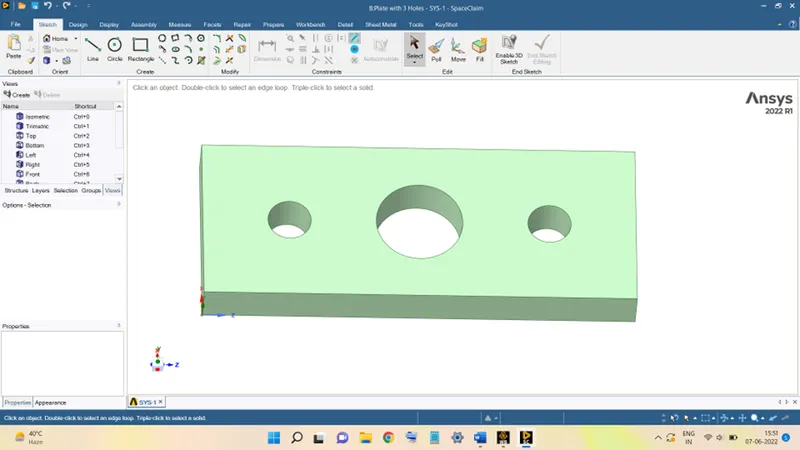
After successfully creating the model close the SpaceClaim and right-click on the ‘Model’ and choose ‘Update’ to load the model into the analysis.
After that, double-click on ‘Set-up’ to launch the Mechanical Analysis Tool.
Once the model is loaded in the tool the model will look like this:
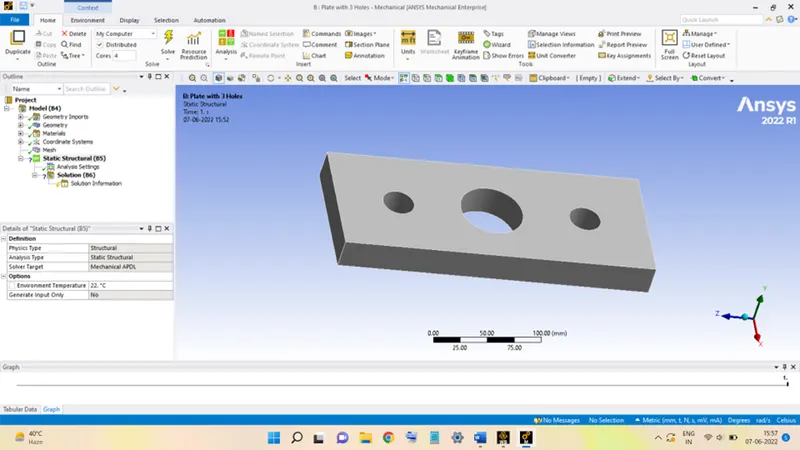
Now as done in the previous analysis, all the steps are performed on this model in the exact same way:
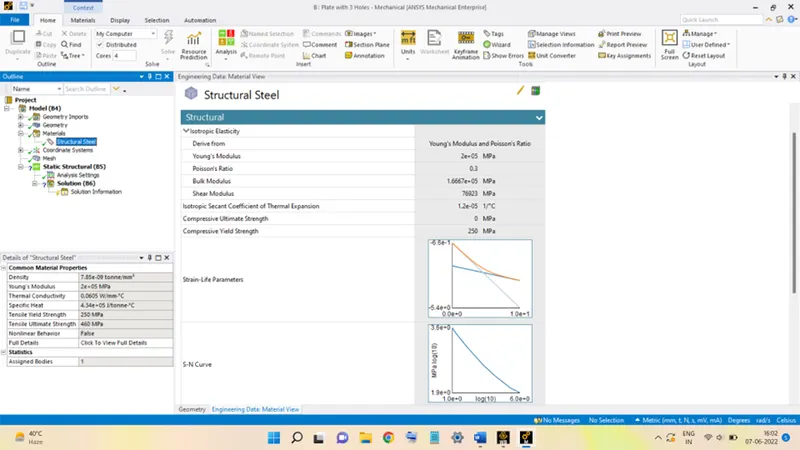
The model is supplied with Structural Steel as the material.
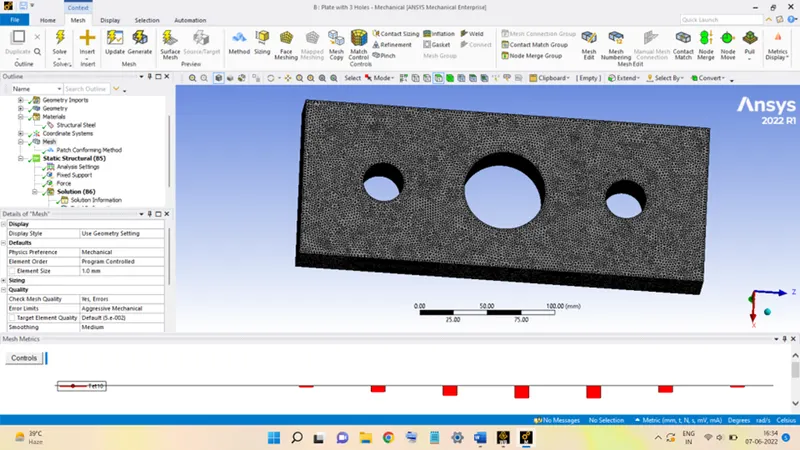
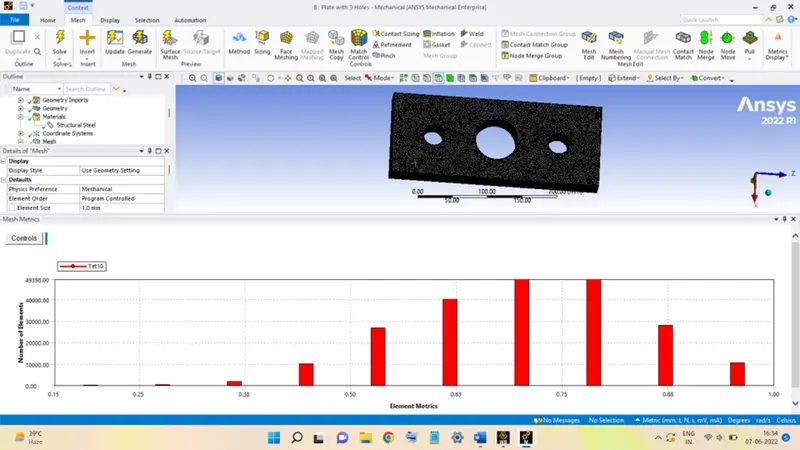
The model is meshed using Tetrahedron elements of size equal to 1 mm.
The model is fixed on the left face and a 500 N tensile force is applied on the right face.
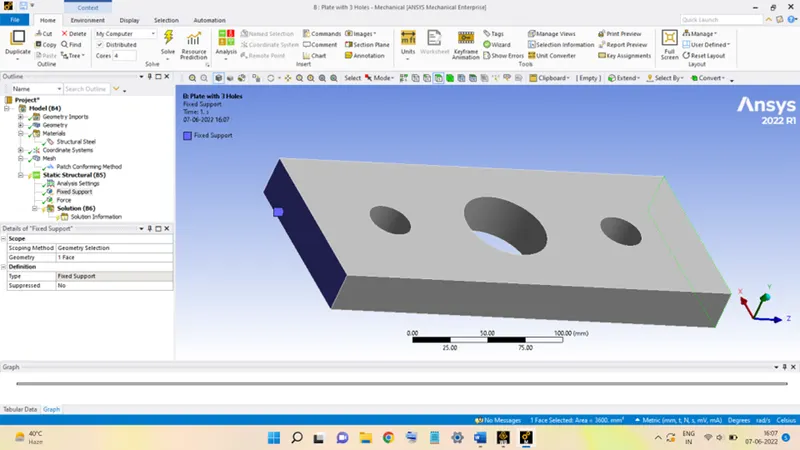
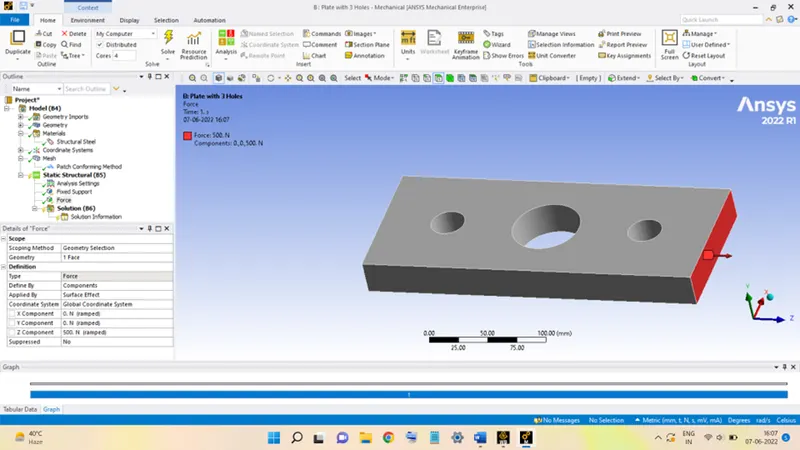
The model is then solved to obtain the Equivalent Stress and Total Deformation.
RESULTS
1. Equivalent Stress:
The stress distribution in the plate due to the loading is shown in the figure below:
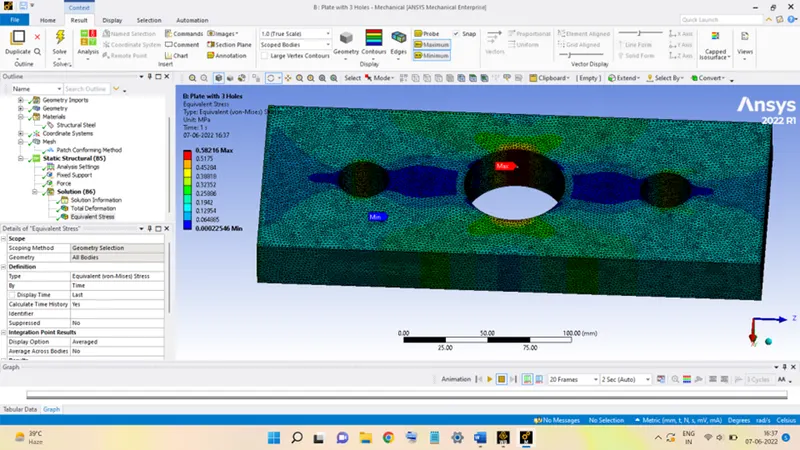
1. From the figure, it can be seen that the maximum stress is acting near the central hole and its magnitude is equal to 0.58216 MPa.
2. In the earlier case, the plate with a single hole, the plate had comparatively more blue patches implying that most of the plate is subjected to very less stress. But in this model, it can be seen the plate is having more green patches, implying that the plate now is subjected to a greater value of the stress. This had to happen, since, there is more material to withstand the load in the previous case.
Total Deformation:
The deformation occurring in the plate due to force acting is shown in the figure below:
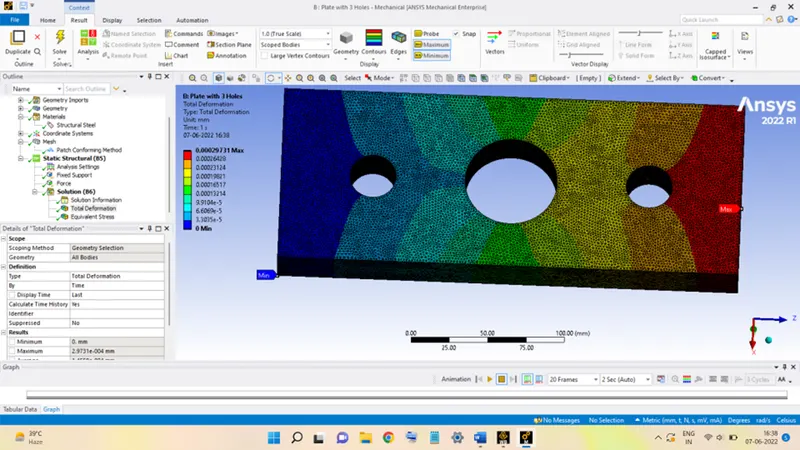
The distribution of the deformation is seen to be somewhat similar to the previous case, however, the magnitude of the maximum deformation is slightly greater, 2.9731x10⁻⁴ mm.
Comparison:
|
|
MAX. EQUIVALENT STRESS (MPa) |
MAX. TOTAL DEFORMATION (mm) |
|
PLATE WITH ONE HOLE |
0.6056 |
2.7494 x 10⁻⁴ |
|
PLATE WITH 3 HOLES |
0.58216 |
2.9731x10⁻⁴ |
From the above comparison, it is seen that:
1. The maximum stress value is lower for the plate with 3 holes, so on increasing the number of holes the effect of the stress concentration is diminished.
2. There is a slight increase in the deformation in the plate with 3 holes, this had to happen since some more material is removed from the plate in form of holes. So, the resistance offered by the plate is reduced and thus the deformation is more.
3. For the same loading condition, the plate with 3 holes is having lesser stress. So, from the analysis standpoint, the plate with 3 holes is better.
4. However, the manufacturing cost incurred in its production will be greater than that for the plate with a single hole, so from the manufacturing perspective, the cost of production is not justified considering the marginal improvement in the plate. Therefore, the plate with a single hole is better considering the manufacturing perspective.
The Workbench file for both the plates is attached below along with the animation videos for stress and deformation.