Supervised Learning - Prediction Week 3 Challenge
Q1. Perform Gradient Descent in Python with any loss function
Answer: In machine learning, the goal is to predict the target variable as close to the ground truth as possible. Thus, the model we adopt for prediction should have reasonable accuracy. As the input values are fixed, to improve the quality of the model, all we can do is tune its parameters such that the deviation of the predicted value from the actual value is highly minimized.
The variation of the expected value from the actual value on a single training example is called the loss function.
The loss function to be used is the mean square error which is defined as

where n = total number of data points
 = Actual outcome
 = predictive outcome
Linear Regression - Gradient Descent
let's write prediction y as mx+b




Q2.Difference between L1 & L2 Gradient descent method
Answer: The two major loss functions are:
. Mean Absolute Error
 = predicted outcome= actual outcome
The following formula shows the relationship.
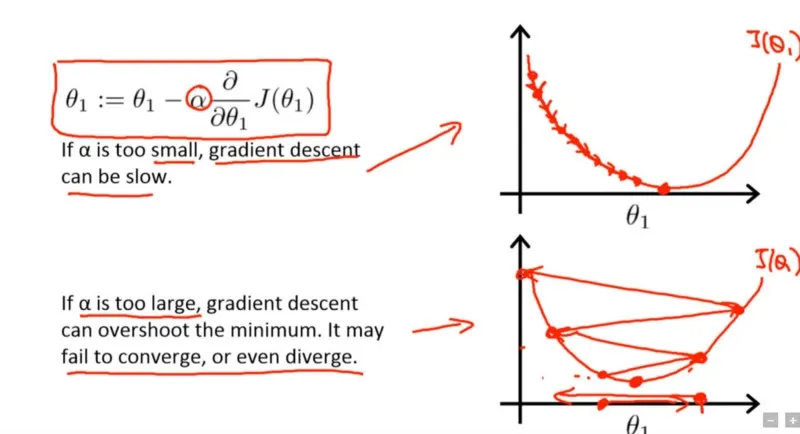
new_weight = existing_weight — learning_rate * gradient


          Gradient descent with small (top) and large (bottom) learning rates


Typically learning rates are configured naively at random by the user. At best, the user would leverage on past experiences (or other types of learning material) to gain the intuition on what is the best value to use in setting learning rates.

As such, it’s often hard to get it right. The below diagram demonstrates the different scenarios one can fall into when configuring the learning rate.
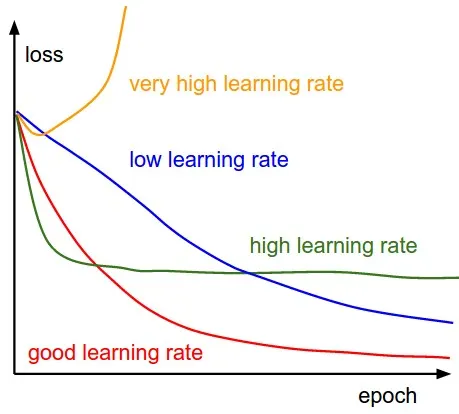
Furthermore, the learning rate affects how quickly our model can converge to a local minima (aka arrive at the best accuracy). Thus getting it right from the get go would mean lesser time for us to train the model.
Less training time, lesser money spent on GPU cloud compute. :)
Q5. How to evaluate linear regression
Model evaluation is very important in data science. It helps you to understand the performance of your model and makes it easy to present your model to other people. There are many different evaluation metrics out there but only some of them are suitable to be used for regression.
There are 3 main metrics for model evaluation in regression:
1. R Square/Adjusted R Square
2. Mean Square Error(MSE)/Root Mean Square Error(RMSE)
3. Mean Absolute Error(MAE)
R Square/Adjusted R Square
R Square measures how much variability in dependent variable can be explained by the model. It is the square of the Correlation Coefficient(R) and that is why it is called R Square.

Mean Square Error(MSE)/Root Mean Square Error(RMSE)
While R Square is a relative measure of how well the model fits dependent variables, Mean Square Error is an absolute measure of the goodness for the fit.
Mean Absolute Error(MAE)
Mean Absolute Error(MAE) is similar to Mean Square Error(MSE). However, instead of the sum of the square of error in MSE, MAE is taking the sum of the absolute value of error.
Q6. What is the difference between multiple and adjusted coefficient of determination
Answer:When the linear regression involves one dependent variable and one independent variable , the regression model is evaluated byor coefficient of determination.
In case of data set with one dependentvariable and several independent variable. the model is evaluated using multiple coefficient of determination.
when the regression model is not influenced by some of the independent variables, we opt for adjusted coefficient of determination.
Any addition of data point where the independent variable can be ignored does not affect the value of
n = number of data points
k = number of independent variables
