Basics of ML & AL Week 2 Challenge
for question 1 file is attached
Q.2)What is the significance of the expected value when a simple mean (Sum of all observations/number of observations) is already in place?
Answer: An expected value gives a quick insight into the behavior of a random variable without knowing if it is discrete or continuous.
Therefore, two random variables with the same expected value can have different probability distributions, another descriptive measure like standard deviation also affect the shape of the distribution. The expected value of a random variable X is denoted as E(X).
Let's say that X is a discrete random variable with possible values X1, X2, X3,......,Xn. Also, p(xi) denoted P(X=xi). Therefore the expected value of X is:
µ=E(X)= Σp(Xi) -Xi ... where the elements are summed over all the values of the random variable X.4
if X is a continuous random variable with a probability density function f(x), the expected value of X is:
µ=E(X)=∫x.f(x)dx
Q.3)Having skewness in the curve considered to be bad in the analysis?
Answer:
- Skewness: Skewness in statistics is a measure of lack of symmetry i.e. it measures the deviation of the given distribution of a random variable from a symmetric distribution (like normal Distribution).
-
Importance of Skewness
The important question arises of what we will do after finding the skewness. Skewness gives the direction of the outliers if it is right-skewed, most of the outliers are present on the right side of the distribution while if it is left-skewed, most of the outliers will present on the left side of the distribution. But the important thing to keep in mind it doesn’t tell about the number of outliers.
Skewness is measured as a coefficient, with the ability for the coefficient to be a positive, negative or zero. The coefficient of skewness is a measure of the degree of symmetry in the monthly return distribution. It allows investors the ability to determine where the majority of monthly returns are going to fall and also point out any outlier events. Let’s take a look at how skewness is measured and how it’s represented graphically: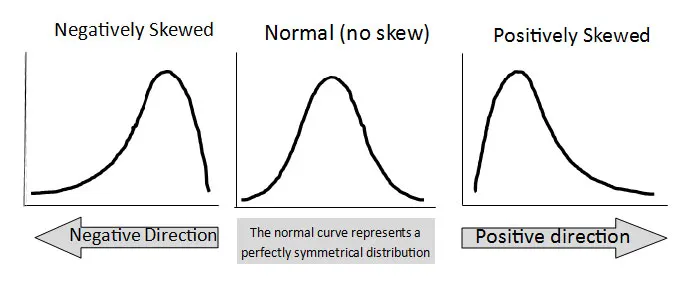
As we can see from the above images, if the left tail (tail at the small end of the distribution) is more pronounced than the right tail (tail at the large end of the distribution), the function is said to have negative skewness. If the reverse is true, it has positive skewness. If the two are equal, it has zero skewness or a symmetrical distribution. Analyzing the skewness of a CTA, allows us to determine where future returns could fall (past performance is not indicative of future results) and where the returns of “black swan” events could potentially fall. An understanding of the skewness of the dataset indicates whether potential deviations from the mean are going to be positive or negative.Negatively skewed distribution
or Skewed to the left
Skewness < 0Normal distribution
Symmetrical
Skewness = 0Positively skewed distribution
or Skewed to the right
Skewness > 0 -
Q4) Evaluate the probabilities for continuous normal distribution with given mean = 680 and standard deviation = 31
a)P(X<711)
b)P(X>740)
c)P(600<x<720)
d)P(X=720)
Answer: To evaluate the probabilities for continuous and normal distribution will use "Z-formula" and Z-table
Z = X- µ/σ
where X = Random Variable
Mean(µ) =680
standard deviation(σ) = 31
a)P(X<711)
Z = 711-680/31
Z = 1
P(Z<1) = 0.8413 from the Z-table.
this is the area to the left of the Z score Since X is less than 711.
b)P(X>740)
Z = 740-680/31
Z = 1.94
P(Z>1.94) = 0.9738 from the Z-table.
this is the area to the left of the Z score Since X is less than 711.
c)P(600<x<720)
Z = 600-711/31 & Z = 1.29
we need to find the area for Z score - 2.58 and 1.29 subtract the values to get the probability.
P(-2.58<Z1.29) = P(Z<1.29) - p(Z< -2.58)
P(-2.58<Z1.29) = 0.9032-0.0047
P(-2.58<Z1.29) = 0.89854
d)P(X=720)
Z = 1.29
P(Z = 1.29) = 0.9015
P(Z = 1.29) = 0.9015 - 0.9015
P(Z = 1.29) = 0
Q.5) Explain the curve on the right side
The given curve is the "Normal Distribution curve" for the random variable and the percentage is the "Standard Deviations" from the mean. The distribution in the curve is perfect without any skewness.
The Normal distribution is a probability function that describes how the values of variance are distributed. It is a symmetric distribution where most of the observations cluster around the central peak
and the probabilities for values further away from the mean taper off equally in both directions.
- 1σ(S.D) from the mean is around 34.1+34.1+13.6+13.6 = 95.4% approx. the values fall in the 2S.D from the mean
- 3σ from the mean is around 34.1+34.1+13.6+13.6 + 2.1+2.1= 99.7% approx. the values fall in the 3S.D from the mean