Supervised Learning - Prediction Week 3 Challenge
2.
|
L1 (mean absolute eerror) |
L2 (mean square error) |
|
1. It has a sparse solution |
It has no sparse solution |
|
2. It generates simple and interpretable models |
It gives more accurate predictions when the output variable is the function of whole input variables |
|
3. Unable to learn complex data patterns |
It is able to learn complex data patterns |
|
4. It gives multiple solutions |
It has only one solution |
|
5. Panelize the sum of absolute values of weights |
Panelize the sum of square weights |
3. Different loss functions are:-
a) MSE [Mean squared error]

Mean squared error (MSE) measures the amount of error in statistical models. It assesses the average squared difference between the observed and predicted values. When a model has no error, the MSE equals zero. As model error increases, its value increases. The mean squared error is also known as the mean squared deviation (MSD).
b) RMSE [Root mean squared error]

Root mean square error or root mean square deviation is one of the most commonly used measures for evaluating the quality of predictions. It shows how far predictions fall from measured true values using Euclidean distance.
c) MAE [Mean absolute error]

The MAE measures the average magnitude of the error in a set of forecasts, without considering their direction. It measures accuracy for continuous variables.
4.
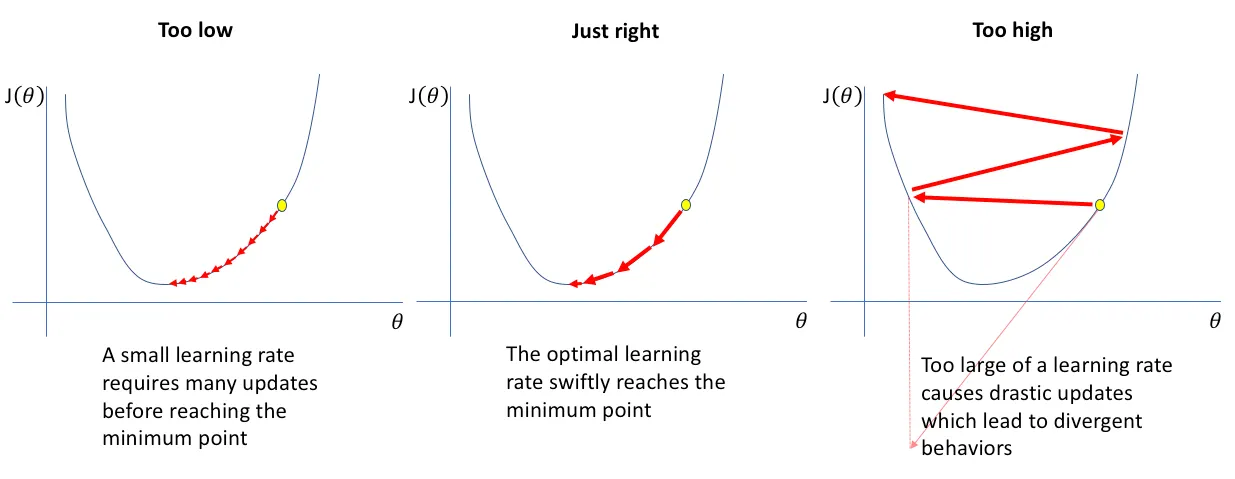
Learning rate is used to scale the magnitude of parameter updates during gradient descent. The choice of the value for learning rate can impact two things: 1) how fast the algorithm learns and 2) whether the cost function is minimized or not.
. A super fast learning algorithm can miss a few data points or correlations which can give better insights on the data. Missing this will eventually lead to wrong classification.
5.
There are 3 main metrics for model evaluation in regression:
- R Square/Adjusted R Square
- Mean Square Error(MSE)/Root Mean Square Error(RMSE)
- Mean Absolute Error(MAE)
R Square is a good measure to determine how well the model fits the dependent variables. However ,it does not take into consideration of overfitting problem. If your regression model has many independent variables, because the model is too complicated, it may fit very well to the training data but performs badly for testing data. That is why Adjusted R Square is introduced because it will penalize additional independent variables added to the model and adjust the metric to prevent overfitting issues.
MSE is calculated by the sum of square of prediction error which is real output minus predicted output and then divide by the number of data points. It gives you an absolute number on how much your predicted results deviate from the actual number. You cannot interpret many insights from one single result but it gives you a real number to compare against other model results and help you select the best regression model.
Compare to MSE or RMSE, MAE is a more direct representation of sum of error terms. MSE gives larger penalization to big prediction error by square it while MAE treats all errors the same.
6.
Multiple R squared is simply a measure of Rsquared for models that have multiple predictor variables. Therefore it measures the amount of variation in the response variable that can be explained by the predictor variables . The fundamental point is that when you add predictors to your model, the multiple Rsquared will always increase , as a predictor will always explain some portion of the variance.
Adjusted Rsquared controls against this increase, and adds penalities for the number of predictors in the model. Therefore it shows a balance between the most simplest model and the best fitting model .Generally, if you have a large difference between your multiple and your adjusted Rsquared that indicates you may have overfit your model.