Structural dynamics
1. Differentiate Static analysis and Dynamic analysis with proper representing pictures
Static Analysis
Definition: Static analysis involves examining code, documents, or artifacts without executing them. It focuses on finding issues through inspection and analysis of the structure, syntax, and other static characteristics.
Characteristics:
• Early Detection: Issues are found before execution, often during development or code review.
• No Execution: The code or program is not run; instead, analysis tools examine the codebase directly.
• Examples: Code reviews, static code analysis tools (e.g., linters, static analyzers).

Dynamic Analysis
Definition: Dynamic analysis involves executing code or software to observe its behavior, performance, or security vulnerabilities during runtime.
Characteristics:
• Requires Execution: The program or system is run with test inputs to observe behavior.
• Real-world Scenarios: Mimics actual usage conditions.
• Examples: Unit tests, integration tests, penetration testing, runtime performance profiling.

2. Explain the following with relevant force-displacement graph
Elastic behavior
Inelastic behavior
Plastic behavior
Non-linear Inelastic behavior
a) Elastic Behavior
Definition: Elastic behavior refers to the property of a material where it deforms reversibly under stress, meaning it returns to its original shape when the stress is removed.
Characteristics: The graph shows a linear relationship between force (stress) and displacement (strain).
Behavior: When a material is elastically deformed, the slope of the F-d curve (which represents stiffness or Young's modulus) remains constant.
Graph Shape: It's a straight line through the origin (0,0), indicating that displacement is directly proportional to the applied force.
b) Inelastic Behavior
Definition: Inelastic behavior occurs when a material deforms permanently (plastically) under stress and does not return to its original shape once the stress is removed.
Characteristics: The graph shows a non-linear relationship where the material undergoes permanent deformation.
Behavior: Initially, it may follow an elastic region (linear), but beyond a certain point (yield point), the material begins to deform plastically.
Graph Shape: After the yield point, the curve may flatten out or show a gradual increase in force with further displacement, indicating plastic deformation.
c) Plastic Behavior
Definition: Plastic behavior specifically refers to the irreversible deformation of a material under applied stress beyond its yield point.
Characteristics: The graph shows a clear yield point where the material transitions from elastic to plastic behavior.
Behavior: Plastic deformation continues with an increase in displacement even if the applied force remains constant or decreases slightly.
Graph Shape: Beyond the yield point, the curve slopes upward as the material undergoes permanent deformation.
d) Non-linear Inelastic Behavior
Definition: Non-linear inelastic behavior refers to materials that do not follow a simple elastic or plastic deformation pattern and exhibit complex behavior under stress.
Characteristics: The graph shows a non-linear relationship between force and displacement.
Behavior: The material may exhibit different stages of deformation, including elastic, plastic, and possibly even phase changes or fracture.
Graph Shape: The curve may have multiple peaks or dips, indicating various stages of stress-strain behavior such as strain hardening, strain softening, or other non-linear effects.
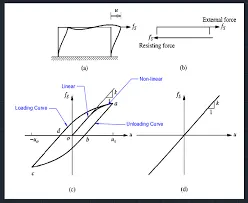
The graph represents the behavioral of the above mentioned systems and the graph obtained is based on the cyclic loading and unloading.
3. Explain Mass, Stiffness & Damping components in the equation of motion
a. Mass (m):
- Definition: Mass (m) represents the measure of inertia of a system, i.e., its resistance to acceleration when a force is applied.
- Role in Equation of Motion: In the equation mx + cx + kx =F(t) m is the coefficient of acceleration (x), indicating how the system's velocity (x) changes in response to applied forces.
- Impact: A higher mass means the system requires more force to achieve a given acceleration, affecting how quickly the system responds to external forces.
b. Stiffness (k):
- Definition: Stiffness (k) is a measure of how resistant a system is to deformation when subjected to an external force.
- Role in Equation of Motion: In the equation mx + cx + kx=F(t), k is the coefficient of displacement (x), indicating the force required to compress or extend the system from its equilibrium position.
- Impact: Higher stiffness values indicate that the system requires more force to produce a given displacement, influencing the frequency and amplitude of oscillations in vibrating systems.
c. Damping (c):
- Definition: Damping (c) refers to the resistance within a system that dissipates energy and opposes motion.
- Role in Equation of Motion: In the equation mx + cx + kx =F(t)m, c is the coefficient of velocity (x), representing the resistive force that depends on the velocity of the system.
- Impact: Damping affects how quickly oscillations decay over time. It absorbs energy from the system, reducing vibrations and preventing oscillations from continuing indefinitely.
4. Provide relationship between
Natural period (Tn) & Natural frequency (f) and provide their definitions
Natural Period (Tn):
Definition: The natural period (𝑇𝑛) of a system refers to the time it takes for one complete cycle of oscillation to occur when the system is disturbed from its equilibrium position and then released.
Units: Typically measured in seconds (s) or sometimes in milliseconds (ms), depending on the specific system.
Natural Frequency (f):
Definition: The natural frequency (𝑓) of a system is the frequency at which it tends to oscillate in the absence of any external forces or damping. It is an inherent property determined by the system's stiffness and mass.
Units: Usually measured in hertz (Hz), which represents cycles per second.
5. Explain
in detail about Response spectrum & its Graph
Definition of a Response Spectrum
A response spectrum is a function of frequency or period, showing the peak response of a simple harmonic oscillator that is subjected to a transient event. The response spectrum is a function of the natural frequency of the oscillator and of its damping. Thus, it is not a direct representation of the frequency content of the excitation (as in a Fourier transform), but rather of the effect that the signal has on a postulated system with a single degree of freedom (SDOF).
Deformation response spectrum:
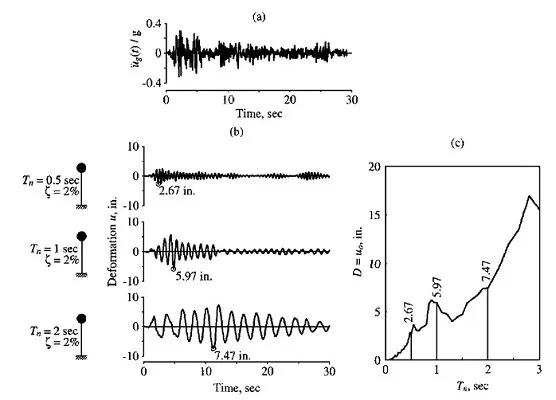
The above image contains the plot with deformation with respect to time time. The 1st plot (a) represents the ground acceleration recorded during a earthquake. The second plot (b) represents the plots of deformation respone of three independent SDF systems. In each plots of b has been done with fixed damping ratio as 2% and variation in natural time period as 0.5s,1s,2s and the corresponding deformations are obtained with respect to time. Finally a plot of recorded dimensions and Tn is done to record the peak responses.So based on the time period of vibration the deformation of the system can be obtained which can be multiplied with stiffness to obtain equivalent static force which can be further used for the analysis of the structure.
Pseudo acceleration response spectrum:
Pseudo acceleration for an single degree of freedom system with natural frequency ωn is related to its peak deformation D = uo, due to earthquake ground motion: A = (ωn^2) * D = ((2π/Tn)^2) * D. The D here represents relative deformation and not total deformation hence, the acceleration obatained is relative so, it is called as pseudo acceleration. The quantity A has units of acceleration and it is related with base shear Vbo. Vbo = fso = mA (or) Vbo = (A/g)*ω. In this formula A/g is base shear coefficient which is acceleration divided by gravitational force. So multiplying this with total mass of the structure provides total base shear or equivalent static force which can be used for analysis of the structure.
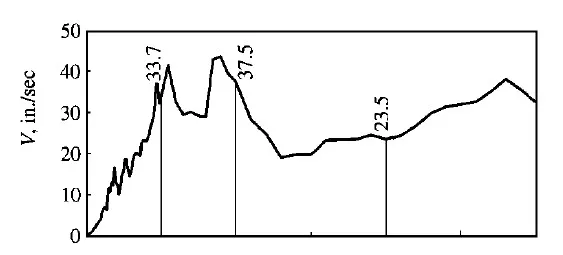
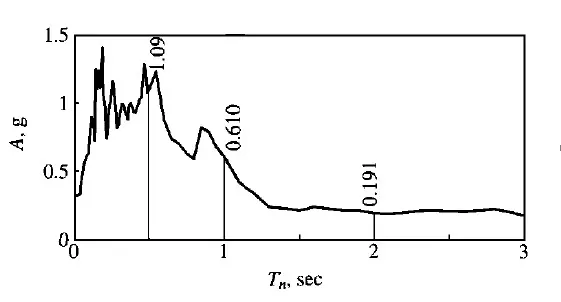
The above image reprsents the graphical difference between deformation spectra and pseudo acceleration spectra. Pseudo-acceleration can be calculated by multiplying deformation with natural circular frequency of vibration at any instant of time.