Steady Vs Unsteady flow over a cylinder
AIM : To simulate steady and unsteady flow over a circular cylinder and to calculate the drag, lift coefficients and Strouhal number.
SIMULATION-SETUP :
- MODEL DESIGN : ANSYS SPACE - CLAIM
- Case setup : ANSYS - FLUENT
- Post-processor : CFD - POST
THEORY :
Flow past the blunt bodies, for example a circular cylinder usually experiences boundary layer separation and strong oscillation in the flow field in the wake region past the body
ie.,, in the region of low pressure. At a particular value of reynold’s number, the flow field will develop a periodic motion of the flow pattern as a result of boundary layer vortices being
shed alternatively from either side of the cylinder. This regular pattern of vortices is called ‘karman vortex street’
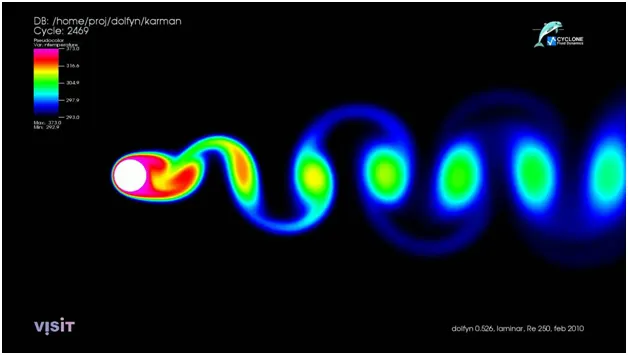
The above created vortices in the flow field makes the flow field to oscillate at a higher frequency which is correlated to the reynold’s number given initially. This shedding vortices may sometime leads to unwanted vibrations in the structures, especially when one of the shedding vortices frequency matches with the natural frequency of the structure, the structure may fail some times.
FLOW SEPERATION : The presence of the fluid viscosity slows down the fluid particles very close to the solid surface and forms a thin slow-moving fluid layer called a boundary layer.
The flow velocity is zero at the surface to satisfy the no-slip boundary condition. Inside the boundary layer, flow momentum is quite low since it experiences a strong viscous flow resistance.
Therefore, the boundary layer flow is sensitive to the external pressure gradient (as the form of a pressure force acting upon fluid particles). If the pressure decreses in the direction of the flow,
the pressure gradient is said to be favorable. In this case, the pressure force can assist the fluid movement and there is no flow retardation. However, if the pressure is increasing in the direction of
the flow, an adverse pressure gradient condition as so it is called exist. In addition to the presence of a strong viscous force, the fluid particles now have to move against the increasing pressure force.
Therefore, the fluid particles could be stopped or reversed, causing the neighboring particles to move away from the surface. This phenomenon is called the boundary layer separation.
WAKE : Wake is a region of high turbulence and low pressure where the flow re-circulates. Now in our case consider few particle in the boundary layer,
wkt the pressure distribution over a cylinder is maximum at it’s stagnation point ie,,, the total pressure and the pressure gradually decreases in the front half of the cylinder since initially (before the flow meets cylinder)
flow as a uniform velocity profile, the flow is attached to the body as expected. However on the other hand in the rear half portion of the cylinder the pressure increases and the particles in this region
experiences higher pressure gradient and consequently the flow separates from the surface creating a high turbulent region behind the cylinder called ‘wake’
However the pressure in the wake region remains low since the flow is highly turbulent and as a result there will be net pressure force produced ie,, pressure drag will be generated.
Vortex Shedding: The boundary layer separates from the surface forms a free shear layer and is highly unstable.
This shear layer will eventually roll into a discrete vortex and detach from the surface (a phenomenon called vortex shedding). Another type of flow instability emerges as the shear layer
vortices shed from both the top and bottom surfaces interact with one another. They shed alternatively from the cylinder and generates a regular vortex pattern (the Karaman vortex street) in the wake.
The vortex shedding occurs at a discrete frequency and is a function of the Reynolds number. The dimensionless frequency of the vortex shedding, the shedding Strouhal number,
St = f D/V, which is approximately equal to 0.21 when the Reynolds number is greater than 1,000.
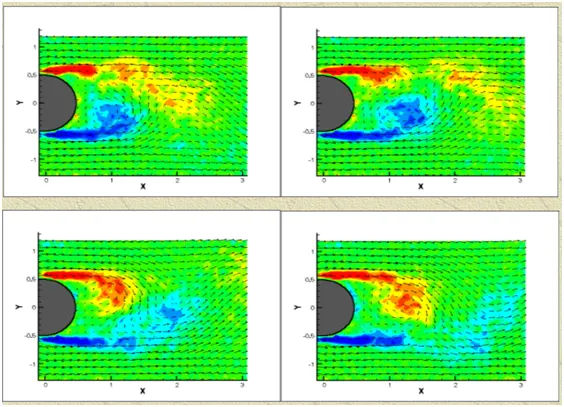
Above figure shows the vortices being shed from the top and bottom surface of the cylinder and also above figure depicts wake region where the flow separates from the body and is turbulent.
Vortex-Induced Vibrations: When vortices shed from the cylinder, uneven pressure distribution develops between the upper and lower surfaces of the cylinder,
generating an oscillatory aerodynamic loading (lift) on the cylinder. This unsteady force can induce significant vibrations on a structure, especially if the "resonance" condition is met.
The frequency generated can be calculated in transient simulation which is useful in calculating the reynold’s number.
GEOMETRY :
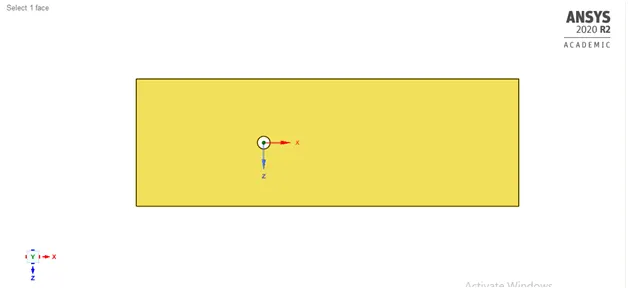
The geometry was designed in Ansys space claim. From the centre of the circle the inlet is at a distance of 20 times the diameter of the cylinder (in 2D circle) and the outlet is at 40 times the diameter of the cylinder.
Diameter of the cylinder is D = 2m
Inlet length = 20*2 = 40m
Outlet length = 40*2 = 60m
On either side the length in vertical direction is 10m ie,,,, in total 20m length. This sets up our 2D-virtual wind tunnel to run the simulation.
MESHING :
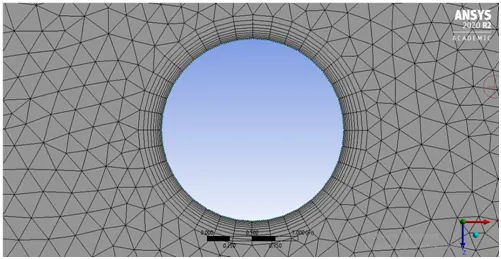
The designed model was discretized into finite number of elements. ANSYS mesher analytically predicted around 42000 triangular cells without any fixed embedding.
Since in any aerodynamic simulation it is important to capture the data accurately, the mesher sizing was made used and triangular mesh was selected and also
10 layers of inflation was added around the cylinder to capture the aerodynamic effects and loading more accurately.
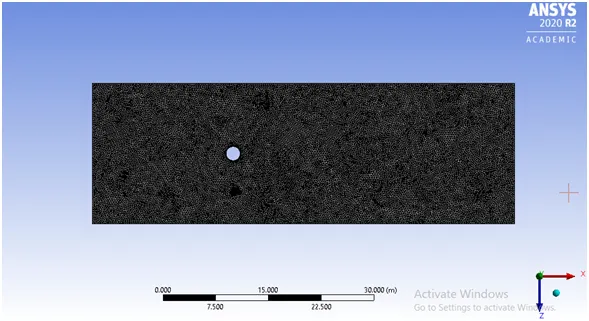
MESHING SPECIFICATION :
Element size : 0.25 m – which discretized the model into 42056 cells or triangular elements.
Sizing type – Triangular element
Number of inflation layer – 10 (around the cylinder)
SIMULATION SETUP :
SOLVER : Steady state and transient solver
TURBULENCING MODELLING : Laminar flow
BOUNDARY CONDITIONS : 1) Inlet - in-flow BC with velocity of 1m/s
2) Outlet - out-flow BC with velocity being NE and gauge pressure being 0 Pa.
3) Cylinder - Wall-type BC with no-slip
4) Top-bottom wall - Wall-type BC with no-slip
MATERIAL PROPERTIES : Medium - air (user-defined)
Density - 1 kg/m*3
viscosity (µ)- 0.02 Pa-s
SIMULATION RESULTS : PART-1
STEADY STATE MONITORING _ RE-100
DRAG PLOTS :
1) DRAG FORCE
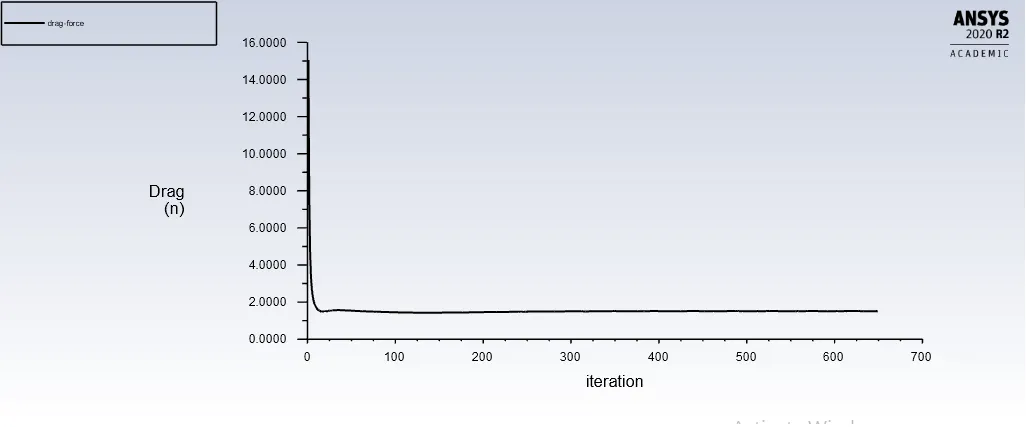
The value of drag force in the above plot for Reynold's number 100 is computed to be 1.5 N
2) DRAG COEFFICIENT :
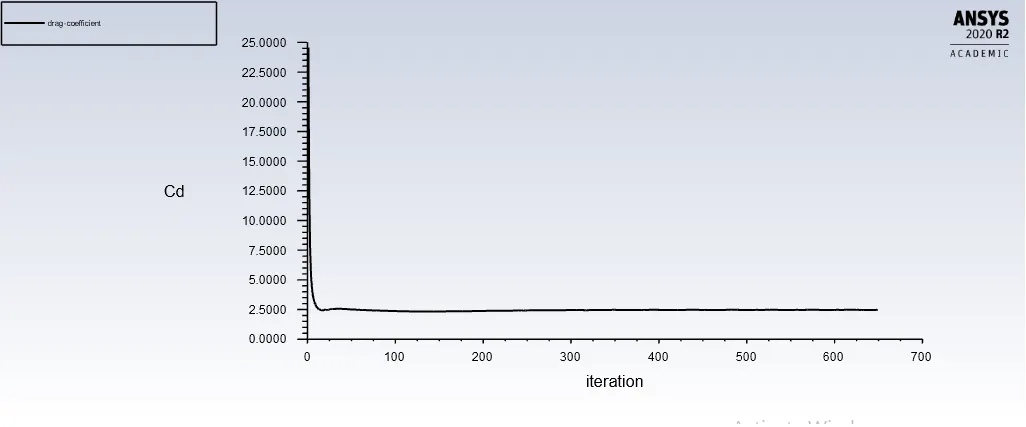
The value of drag coefficient in the above plot for Reynold's number 100 is computed to be 2.163
3) LIFT FORCE
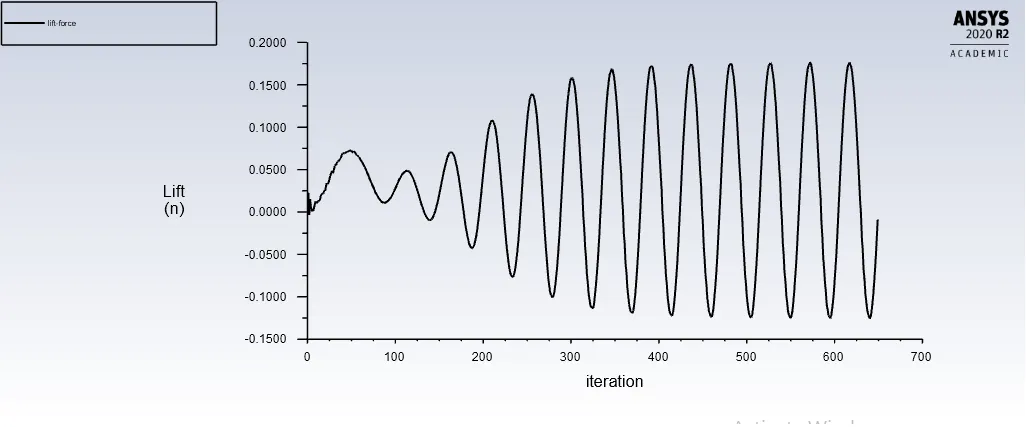
The value of drag force in the above plot for Reynold's number 100 is computed to be 0.0127 N
4) LIFT COEFFICIENT
The value of lift coefficient in the above plot for Reynold's number 100 is computed to be 0.02 N
5) MONITOR POINY VELOCITY :
A point was choosen in the x-axis at a distance of 4 times the diameter of the cylinder ie,,, at 8m from the cylinder to monitor the velocity there
and to caluclate the value of strouhal number or the given reynold's number.
The average value of the velocity converged to be 0.62 m/s at a distance of 8m from the cylinder.
6) VORTEX SHEDDING
In order for growth of boundary layer the flow velocity is satisfied to zero velocity at the surface ie,,, no-slip boundary condition.
Initially the flow has a uniform velocity profile untill the flow interacts with the cylinder. Once the flow interacts with the cylinder due to the presence of viscous forces a small
thin layer of fluid flow gets developed near the contact surface of the solid body, this small region of fluid flow is called as 'boundary layer' . Once this layer is formed the fluid particels inside it
experiences low momentum as fact due to the presence of viscous forces. If the pressure in the direction of fluid flow decreases then fluid particles in this region experiences no retardation and in fact the
pressure force assist the movement of the particles. On rhe other hand if we consider the pressure force increasing in the direction of fluid flow, then the particles in this region experiences a strong retardation and
sometimes may stop. This causes the fluid particles to seperate from the contact surface of the fluid and hence the flow seperates, this seperation is called as 'boundary layer seperation' as shown in the above figure (just past the cylinder).
Now the seperated flow creates an uneven pressure distrunution past the cylinder causing turbulence and decrease in pressure, this region is called as 'wake' (low pressure and high turbulence). Once this region is formed
the seperated boundary layer creates an oscillating flow pattern which results in aerodynamic loading causing the generation of lift and drag. This causes the formation of free shear layer which eventually rolls into circular pattern called
'vortices' in other words 'vortex shedding' . If this shear layer sheds the vortices simultaneously from the top and bottom of the cylinder and they meet, then this results in a phenomenon called as regular vortex shedding ot 'Karman Vortex Street'
Above plot depicts the vortex shedding (Karman vortex street).
When vortices shed from the cylinder, uneven pressure distribution develops between the upper and lower surfaces of the cylinder,
generating an oscillatory aerodynamic loading (lift) on the cylinder. This unsteady force can induce significant vibrations on a structure, especially if the "resonance" condition is met.
The frequency generated can be calculated in transient simulation which is useful in calculating the reynold’s number.
TRANSIENT STATE MONITORING _ RE-100
DRAG PLOTS :
1) DRAG COEFFICIENT :
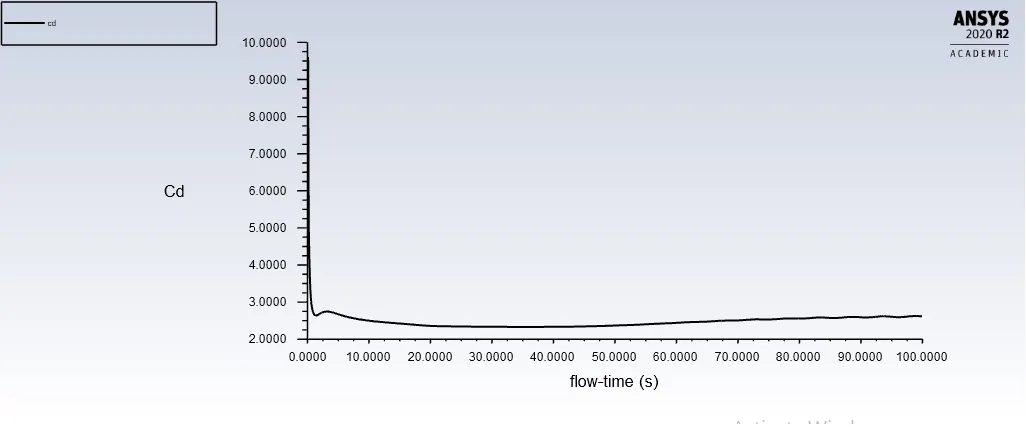
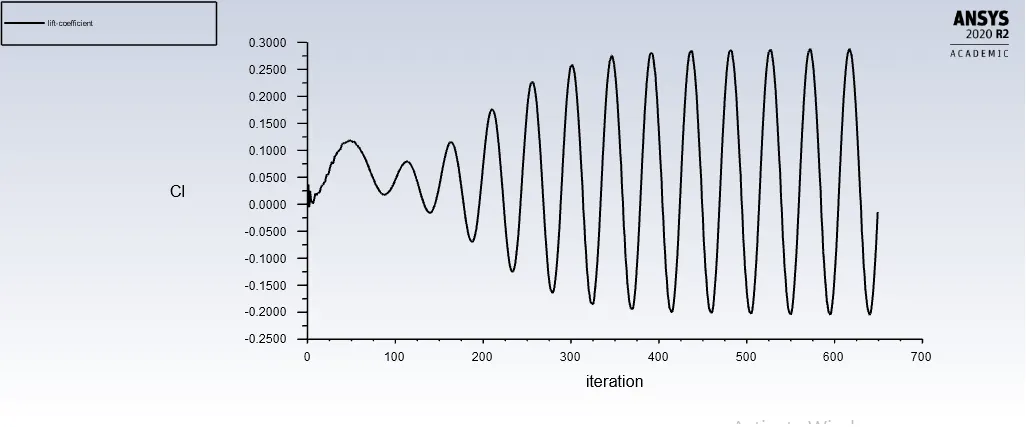
3) LIFT COEFFICIENT
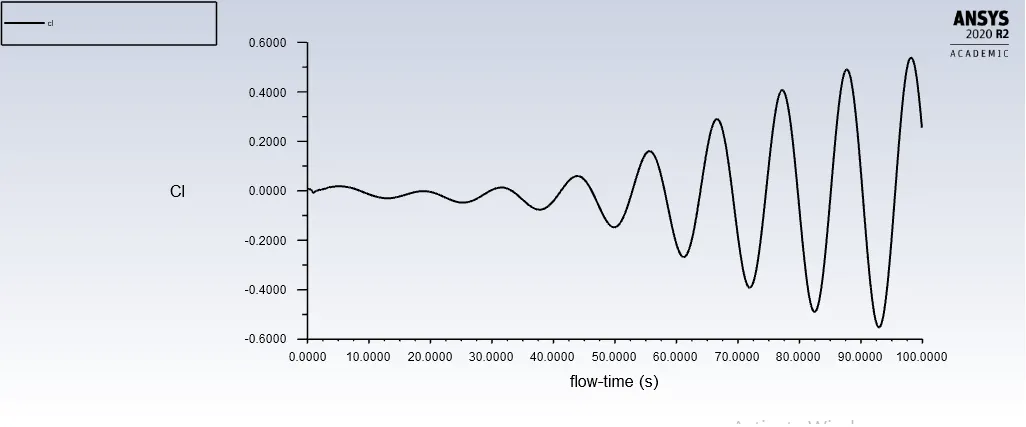
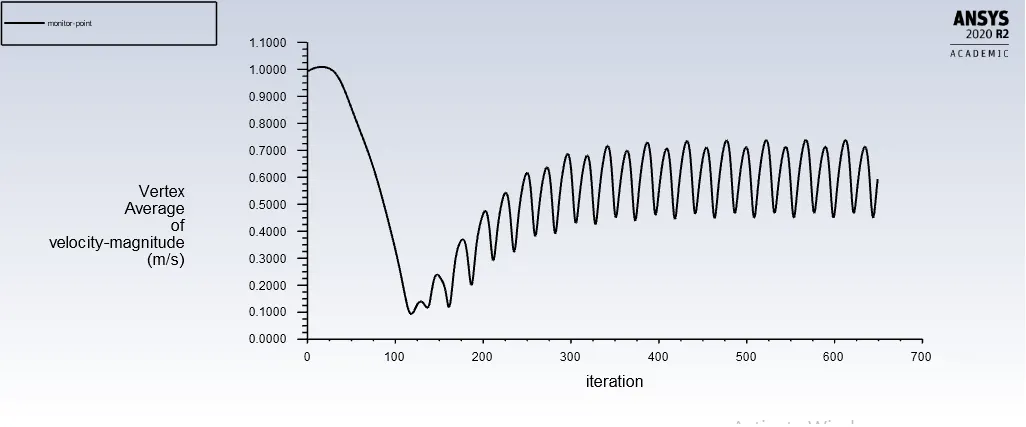
4) MONITOR POINY VELOCITY :
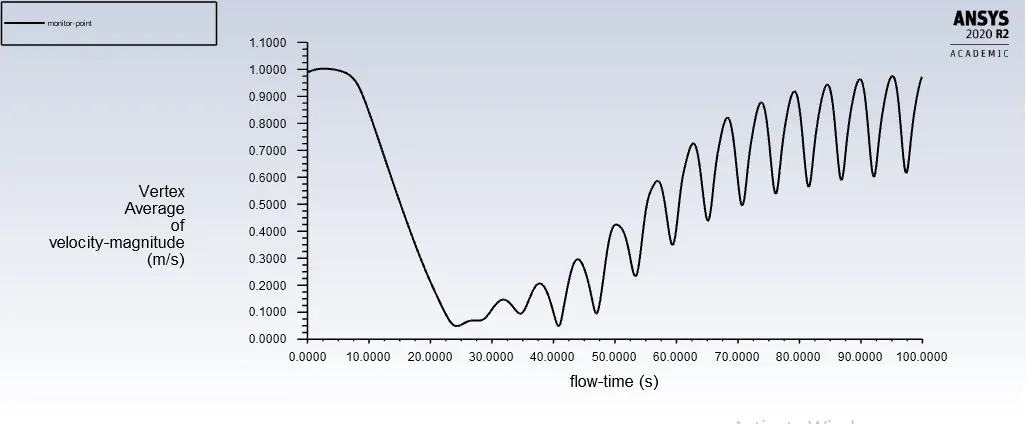
A point was choosen in the x-axis at a distance of 4 times the diameter of the cylinder ie,,, at 8m from the cylinder to monitor the velocity there
and to caluclate the value of strouhal number or the given reynold's number. The velocity converged to a value of 0.716 m/s
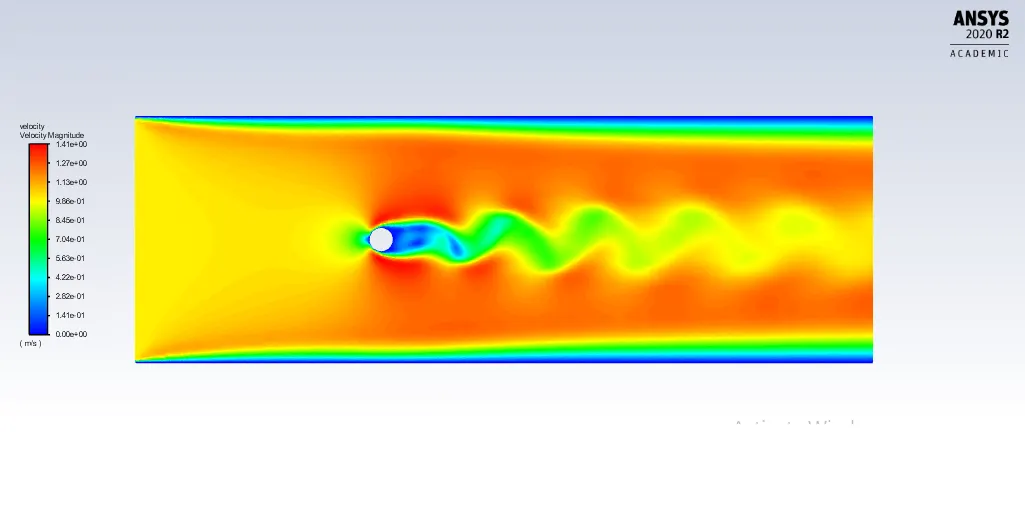
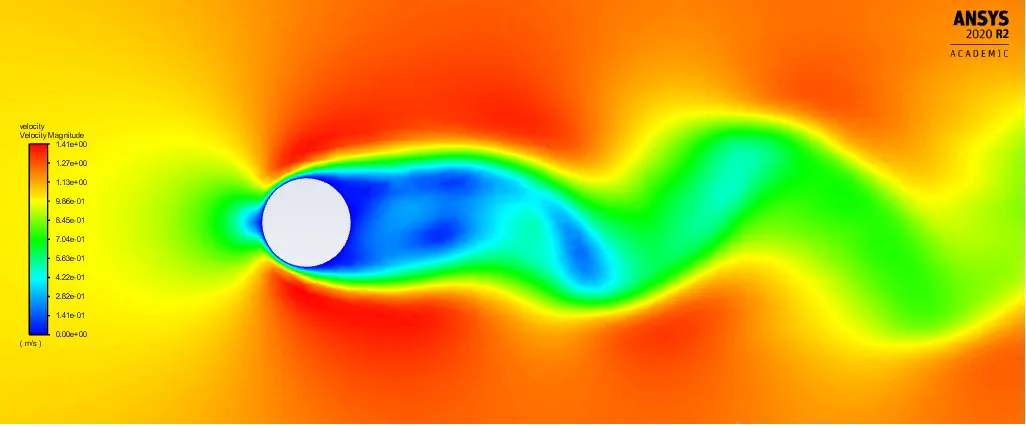
5) VORTEX SHEDDING
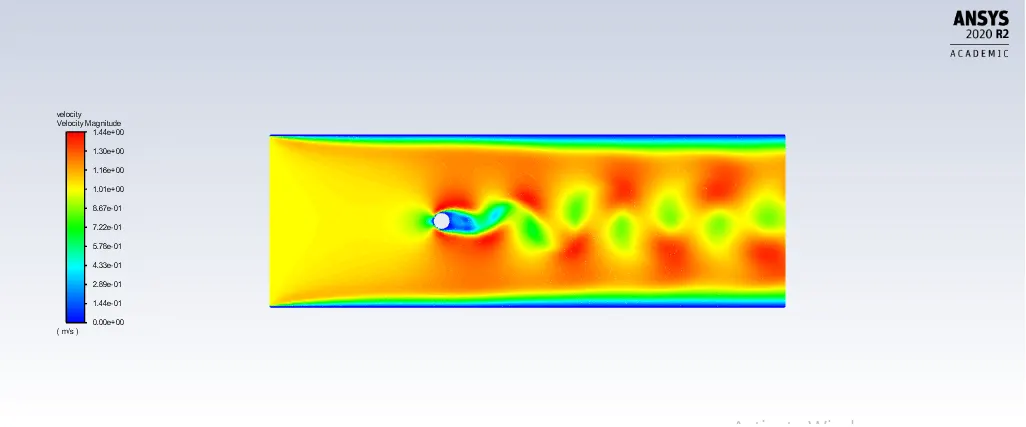
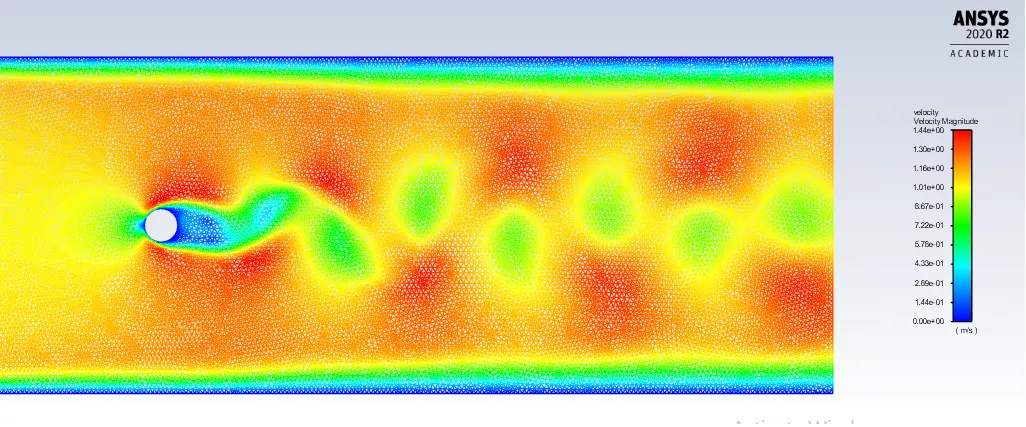
Above plot shows the shedding of regular vortices and which is much more clearly visible in case of transient state simulations. These regular vortices are called
as ' Karman vortex street '
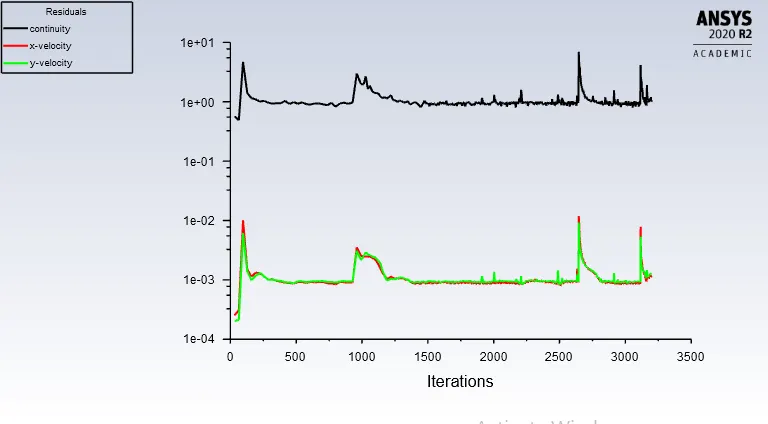
5) RESIDUALS
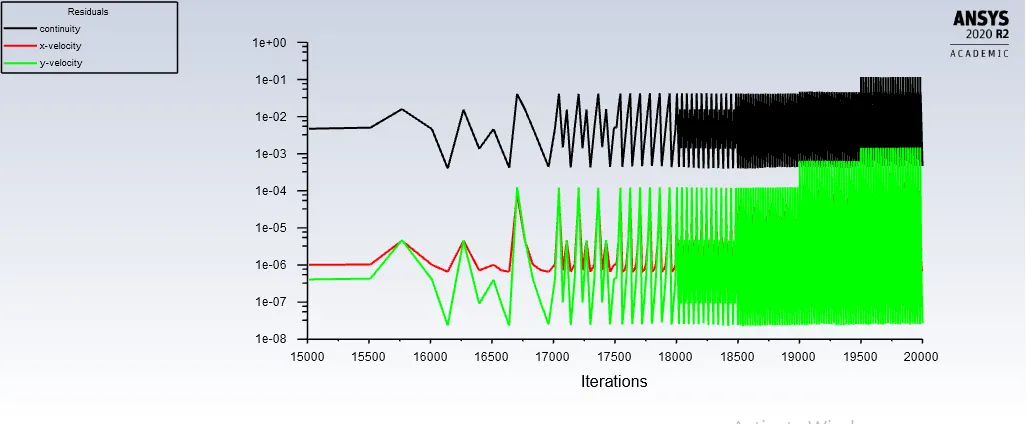
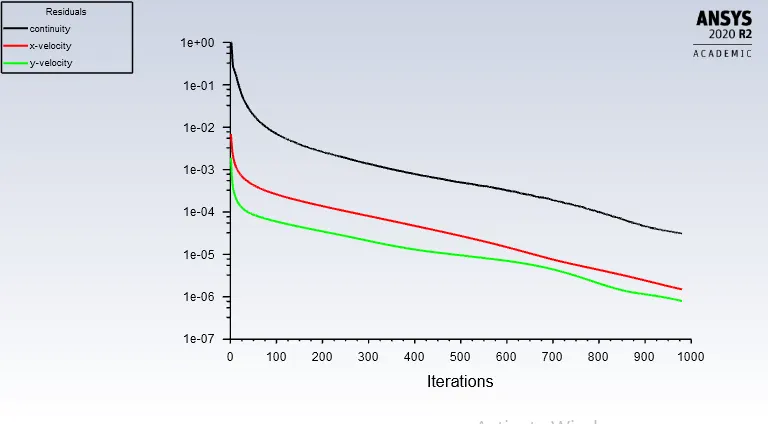
Residuals are the set of equation assigned in a simulation. Above plot shows the convergence of different parameters like continuity, velocity and so on.
The solution is almost approaching convergence at the end of the iterations.
CALUCLATION OF STROUHAL NUMBER :
The vortex shedding occurs at a discrete frequency and is a function of the Reynolds number. The dimensionless frequency of the vortex shedding, the shedding Strouhal number,
St = f D/V,
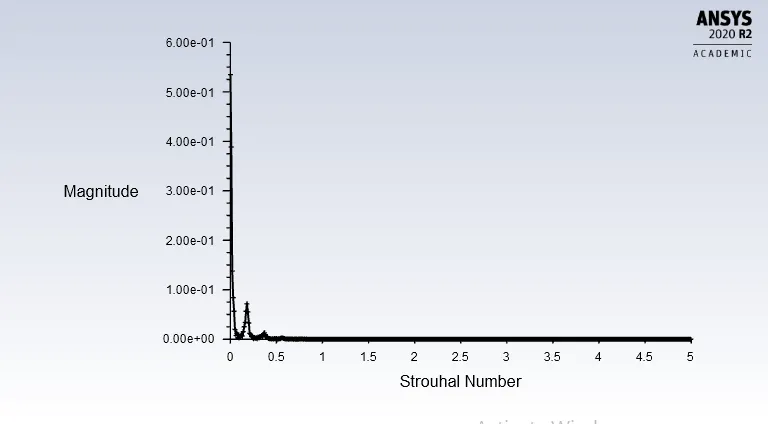
From the above plot the strouhal number is found to be around 0.
PART-2 : Calculating the coefficient of drag and lift over a cylinder by setting the Reynolds number to 10,100,1000,10000 & 100000 (STEADY-STATE SOLVER)
RE-10
DRAG FORCE AND COEFFICEINT :
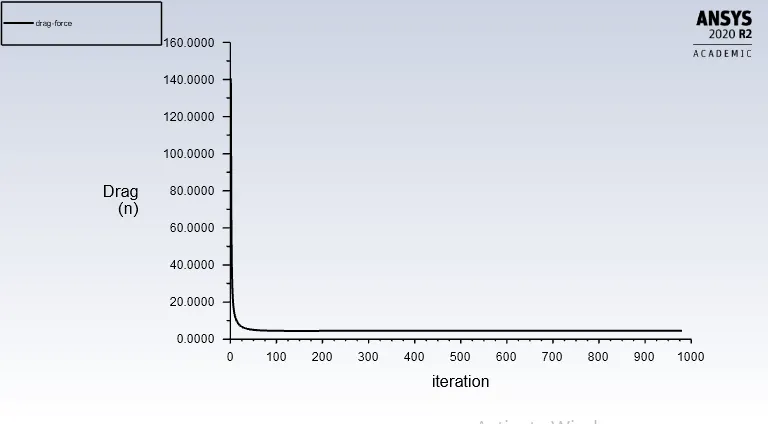
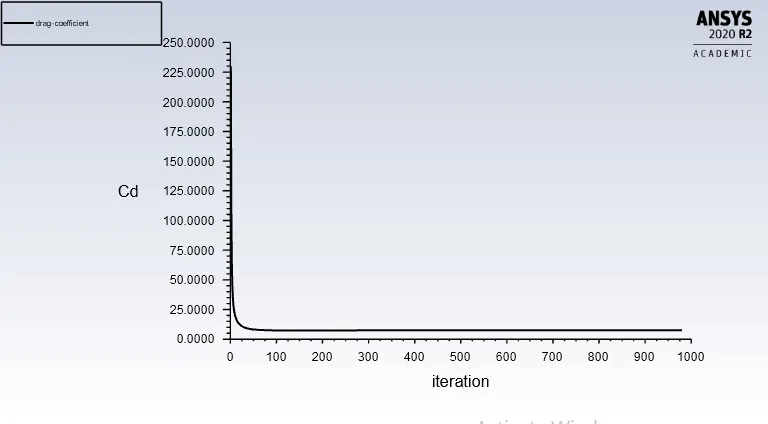
The drag force converged to a value of 4.5 N at the end of the simulation. The drag coefficient converged to a value of cd = 7.29 for Re of 10
LIFT FORCE AND COEFFICEINT :
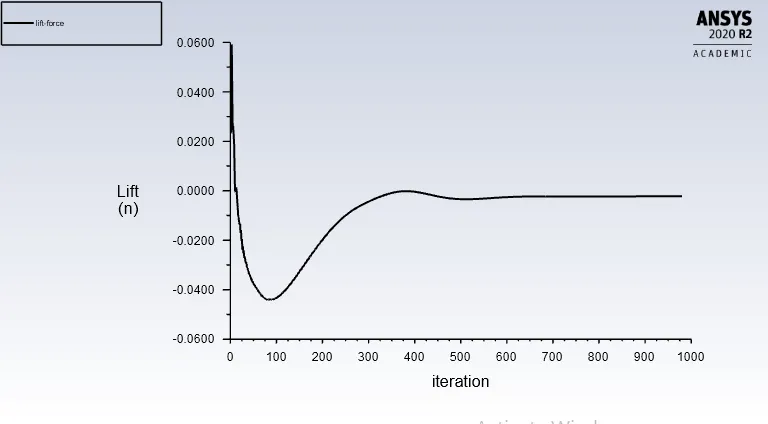
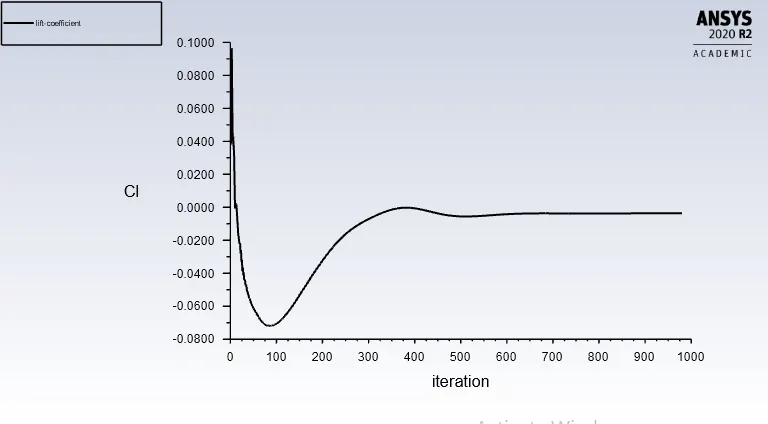
The lift force converged to a value of -0.0025 N at the end of the simulation. The lift coefficient converged to a value of cl = -0.0036 for Re of 10.
The lift force and lift coefficient generated is negative because, the flow has a lesser reynold's number of Re = 10 and the aerodynamic loading
created on the upper surface and lower surface of the cylinder is low ie,,,, the pressure distribution is low and this results in no lift generation. In other words
negative lift is generated in the downward direction and hence the lift coefficient is negative.
MONITOR POINT VELOCITY :
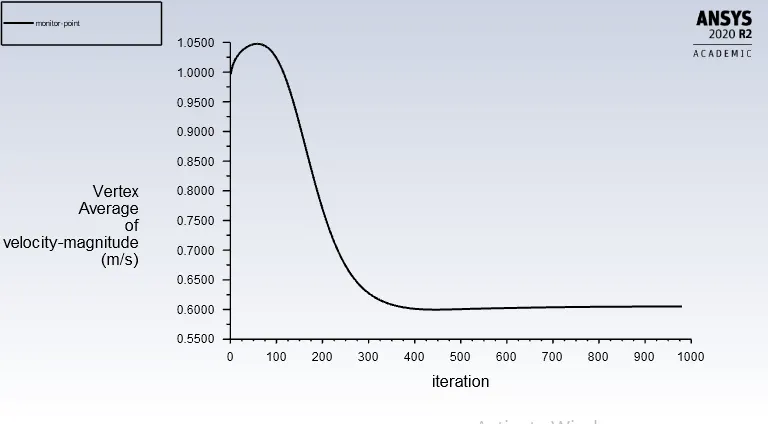
The velocity converged to a value of 0.605 m/s. Above plot shows no blip or variation in peak when the solution is converging, this shows that the flow field is steady
and there is no oscillation in the flow field and there is no formation of any vortices.
VORTEX :
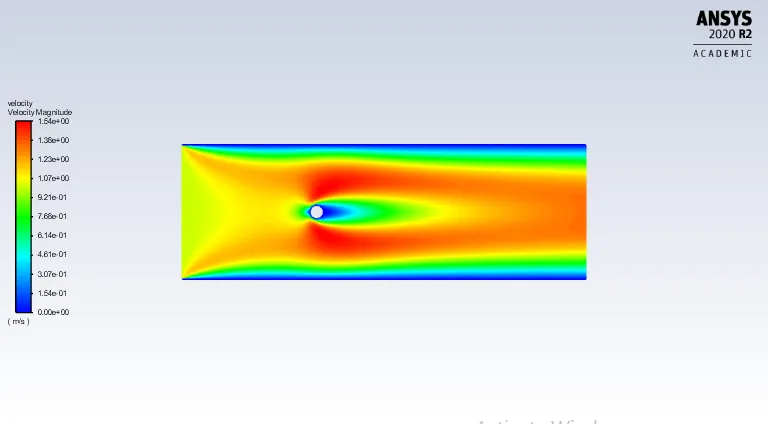
Since the flow has a lesser reynold's number there is no formation of any vortex shedding or karman vortex street as the flow is attatched to the bpdy
and there is no boundary layer seperation taking place.
DEPICTING FLOW BEHAVIOUR :
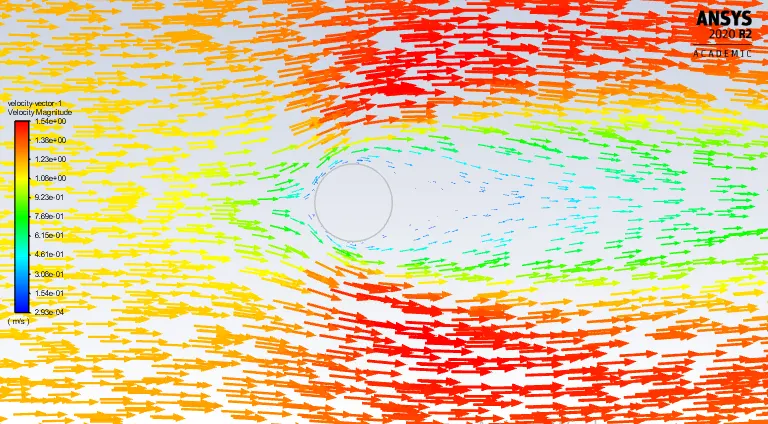
Above plot shows the behaviour of flow, which is attatched to the body and the flow does'nt seperate to form any vortices.
RESIDUALS :
RE-1000
DRAG FORCE AND COEFFICEINT :
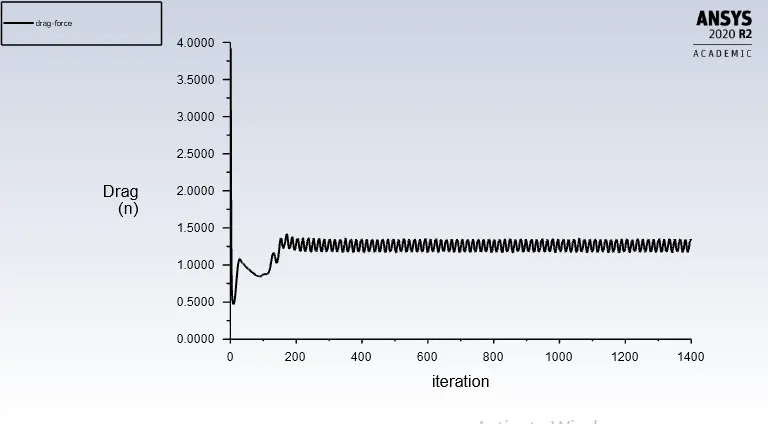
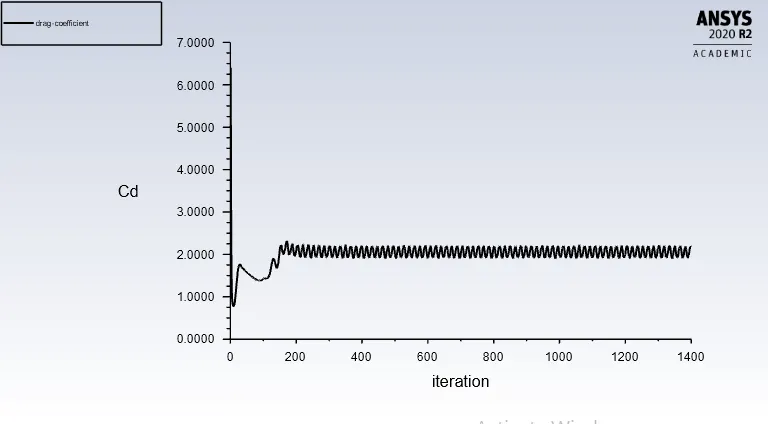
The drag force converged to a value of 1.33 N at the end of the simulation. The drag coefficient converged to a value of cd = 2.065 for Re of 1000
LIFT FORCE AND COEFFICEINT :
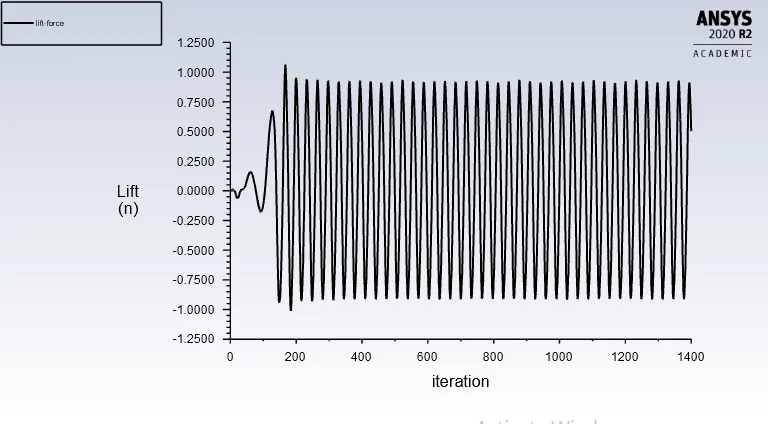
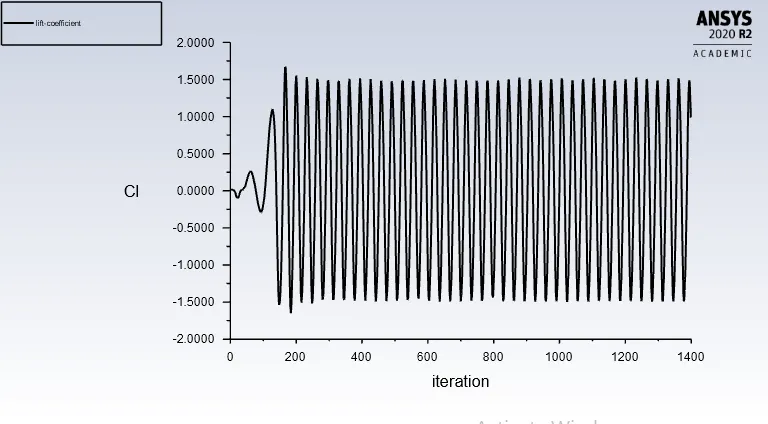
The lift force converged to a value of 0.525 N at the end of the simulation. The lift coefficient converged to a value of cl = 0.82 for Re of 1000.
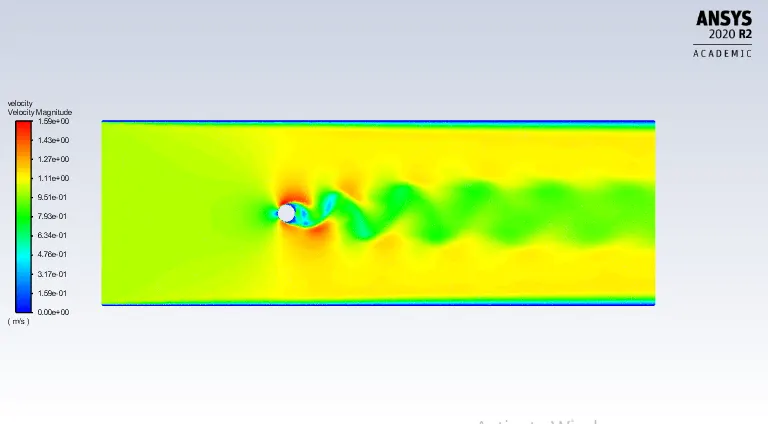
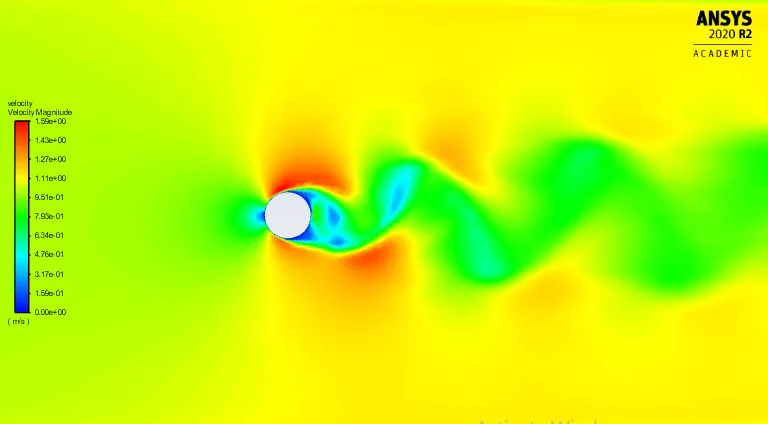
VORTEX SHEDDING :
MONITOR POINT VELOCITY :
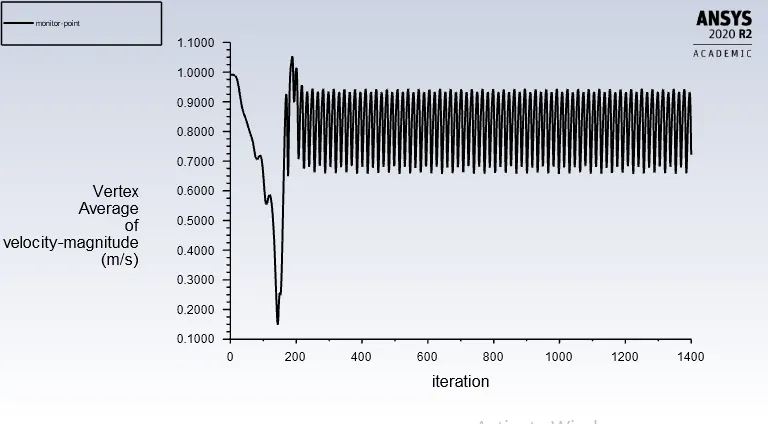
The velocity converged to a value of 0.725 m/s. Above plot shows blip or variation in peak when the solution is converging, this shows that the flow field is not steady
and there is oscillation in the flow field and there is formation of vortices and since the variation is regular we can expect the formation of regular shedding vortices or karman vortex street.
RESIDUALS :
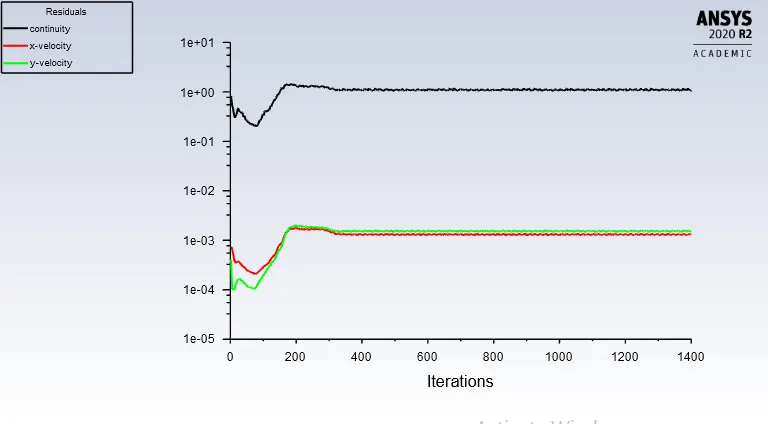
The residuals of the simulation converges after 400 iterations performed and solution is said to be converged as there are no variation in the plot above after 400 iterations.
RE-10000
DRAG COEFFICEINT :
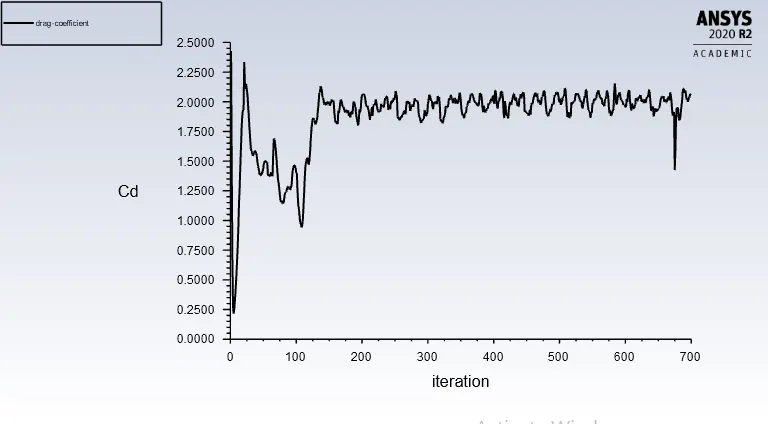
The drag coefficient converged to a value of cd = 1.856 Re of 10000
LIFT COEFFICEINT :
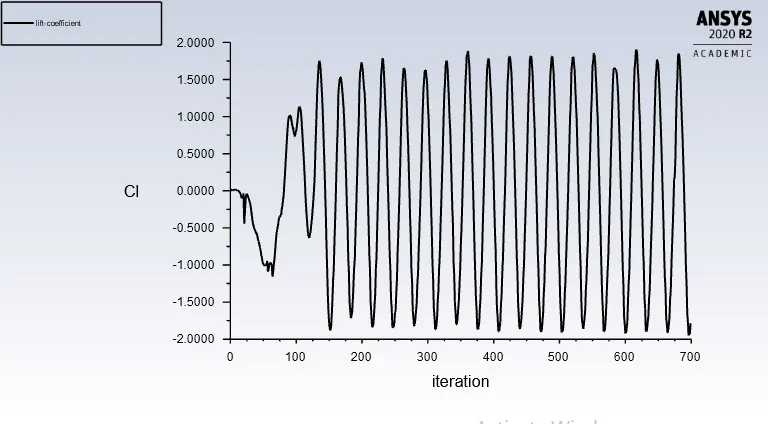
The lift coefficient converged to a value of cl = -1.6 for Re of 10000
MONITOR POINT VELOCITY :
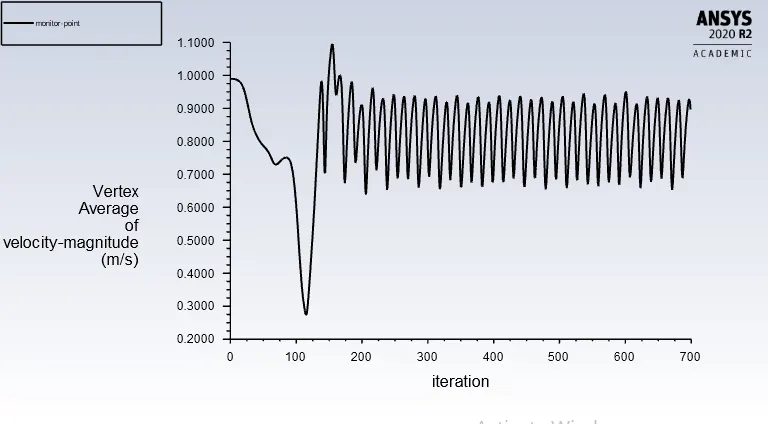
The velocity converged to a value of 0.842 m/s. Above plot shows blip or variation in peak when the solution is converging, this shows that the flow field is not steady
and there is oscillation in the flow field and there is formation of vortices and since the variation is regular we can expect the formation of regular shedding vortices or karman vortex street.
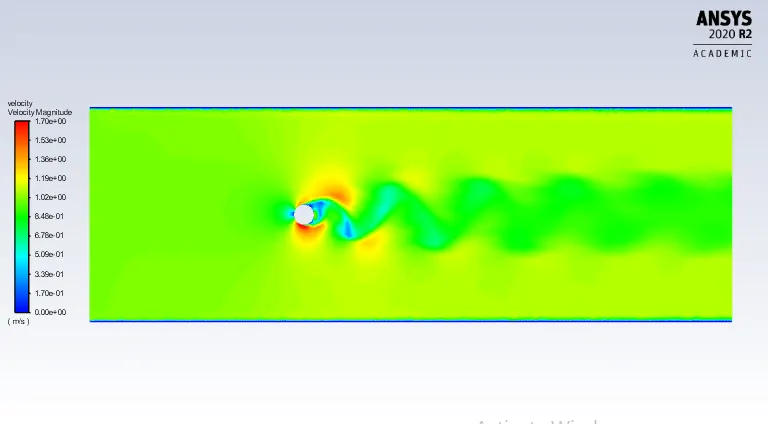
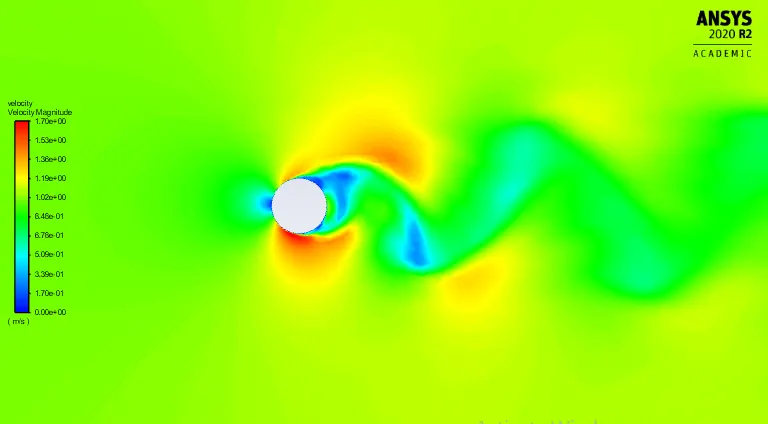
VORTEX SHEDDING :
RESIDUALS :
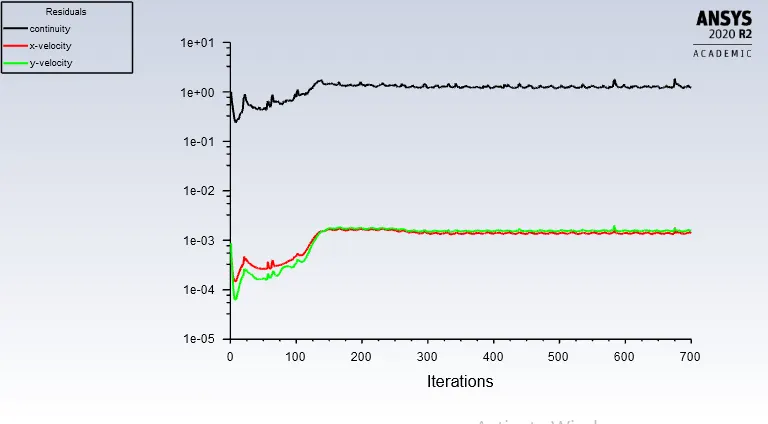
The residuals of the simulation converges after 400 iterations performed and solution is said to be converged as there are no variation in the plot above after 400 iterations.
RE-100000
DRAG FORCE AND COEFFICIENT
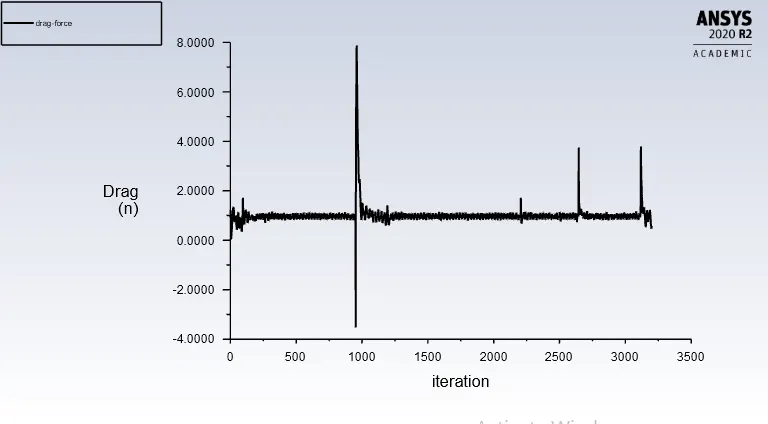
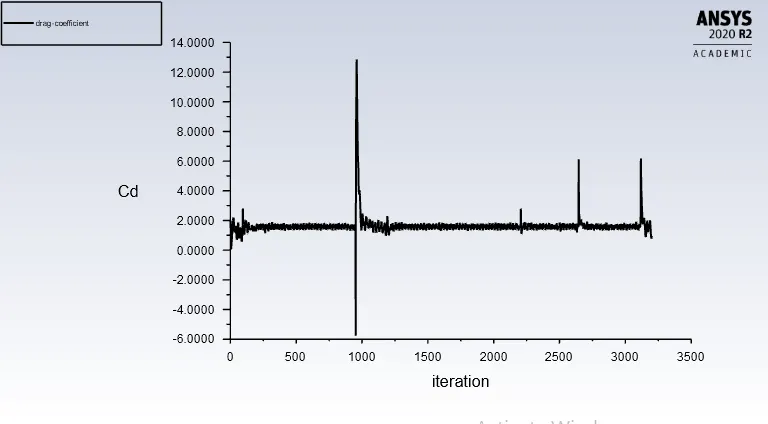
The drag force converged to a value of 0.6 N at the end of the simulation. The drag coefficient converged to a value of cd = 1.065 for Re of 100000
LIFT FORCE AND COEFFICEINT :
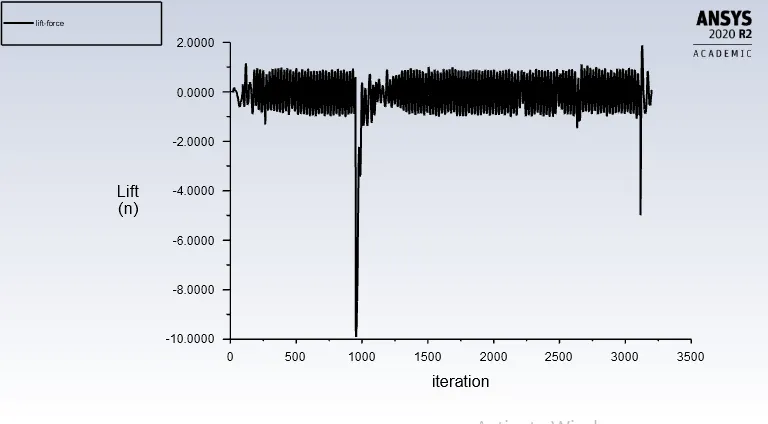
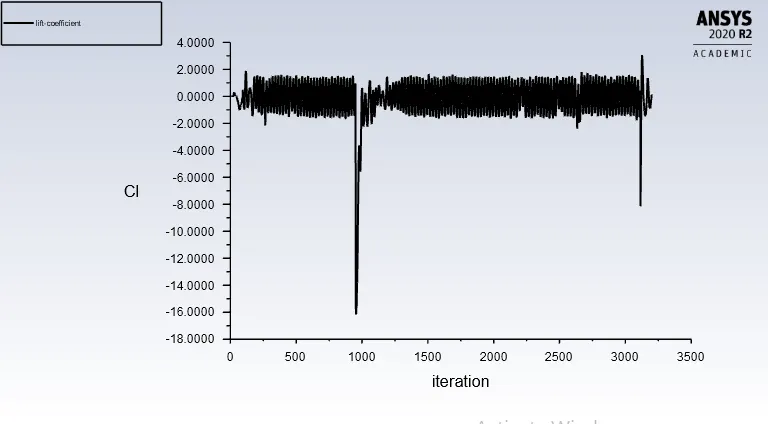
The lift force converged to a value of 0.0839 N at the end of the simulation. The lift coefficient converged to a value of cl = 0.1 for Re of 100000
MONITOR POINT VELOCITY :
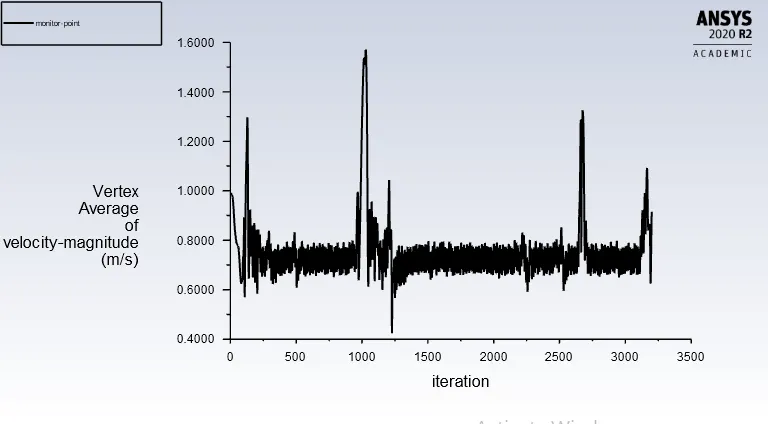
The velocity converged to a value of 0.942 m/s at the end of the simulation.
VORTEX SHEDDING :
DEPICTING FLOW BEHAVIOUR :
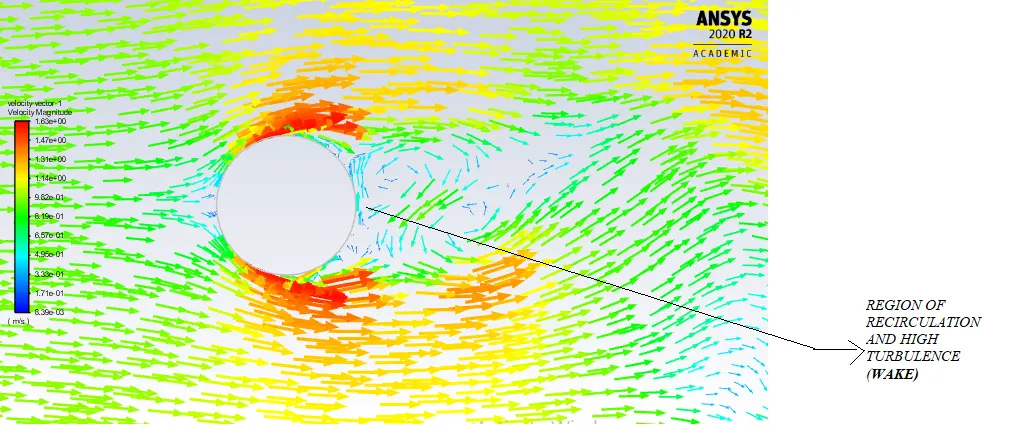
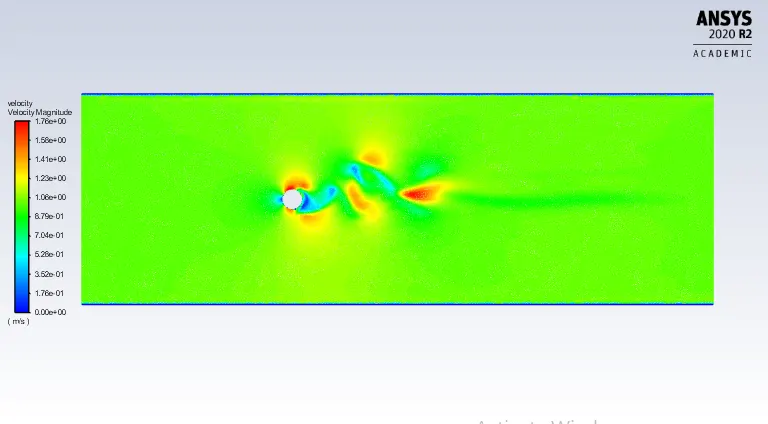
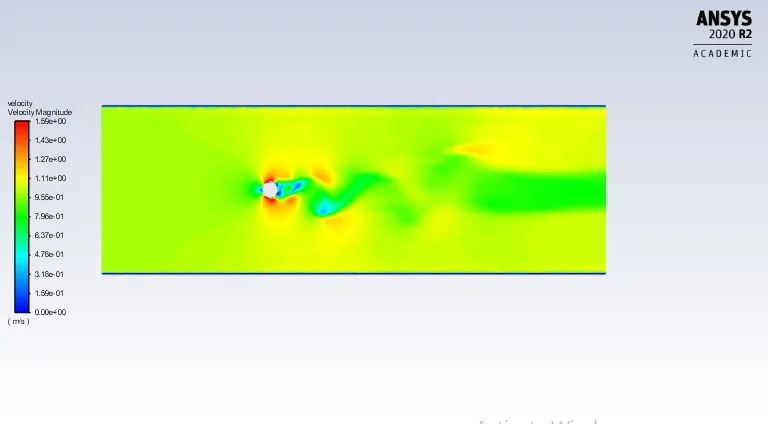
Above plot shows the seperation of flow ie,, boundary layer seperation which casuses an uneven aerodynamic loading and uneven pressure distribtuion. This results in a region
circulation called wake, which is of low pressure and high turbulence and results in vortex shedding known as 'karman vortex street' .
RESIDUALS :
Effect of Reynolds number on the coefficient of drag :
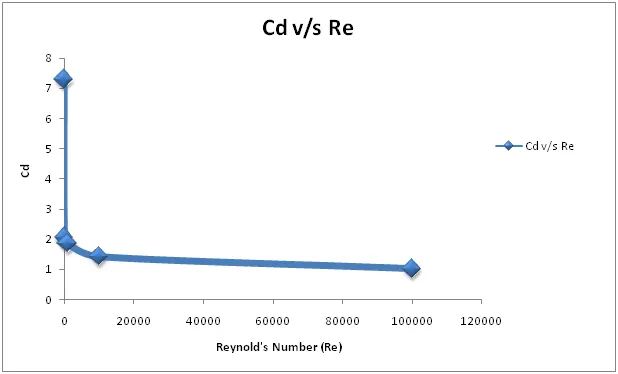
Above plot shows the variation of Cd for diffrent reynold's number. It is observed that with increase in reynold's number the drag coefficient generated decreases. This is because consisder the equation of Cd which is given by
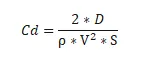
with the increase in reynold's number the velocity of the flow increases and inturn as Cd ia inversly propotional to square of the velocity the drag coefficient will decrease drastically as shown in the above plot.
CONCLUSION
In this study, the effects of accelerated flow on a 2D bluff body were analyzed numerically.
To investigate the drag increase and its relationship with the form and development of the wake behind
the cylinder, this study employed a finite-volume based computational fluid dynamics method using ANSYS FLUENT.
The value of Cd decreases as Re and't' increase, whereas the value of Cd increases as Re and 't'
increase. When Cd is expressed over time t, the inflection point at which the slope increases sharply is
observed. The results also show that the smaller the acceleration, the smaller the value.