State flow charts - Gear shifting and washing machine technology
Question
- Implement control logic of a “washing machine” using Stateflow as per given sequence:
- If the power supply is available, the system gets activated
- If the Water supply is not available, stop the process & indicate through LED
- Soaking time should be 200s followed by Washing time of 100s.
- Then rinsing happens for next 20s & dryer runs for 50s
After all the processes have completed turn on the finished LED
2. Make a Simulink chart for the “Gear shift” logic as per below conditions:
Speed Range(kmph) Gear
0 to 15 1
16 to 25 2
26 to 40 3
41 to 60 4
Above 61 5
Give speed input while the simulation is running & display the gear number.
Grading Policy :
- Upload the supporting results as images or by any other means
- Write a detailed report
- Report attached as an image will lead to zero marks
- plagiarism is not tolerated
- upload Simulink files if needed through the google drive, any external links will not be accepted
Your Answers
STUDY1-
AIM-
- Implement control logic of a “washing machine” using Stateflow as per given sequence:
- If the power supply is available, the system gets activated
- If the Water supply is not available, stop the process & indicate through LED
- Soaking time should be 200s followed by Washing time of 100s.
- Then rinsing happens for next 20s & dryer runs for 50s
After all the processes have completed turn on the finished LED
Software used - Matlab,Simulink.
Proceudre-
In simulink click on charts and the interface appaers where we need to write our control logic.
According to the given sequence and time space design the state points as below-
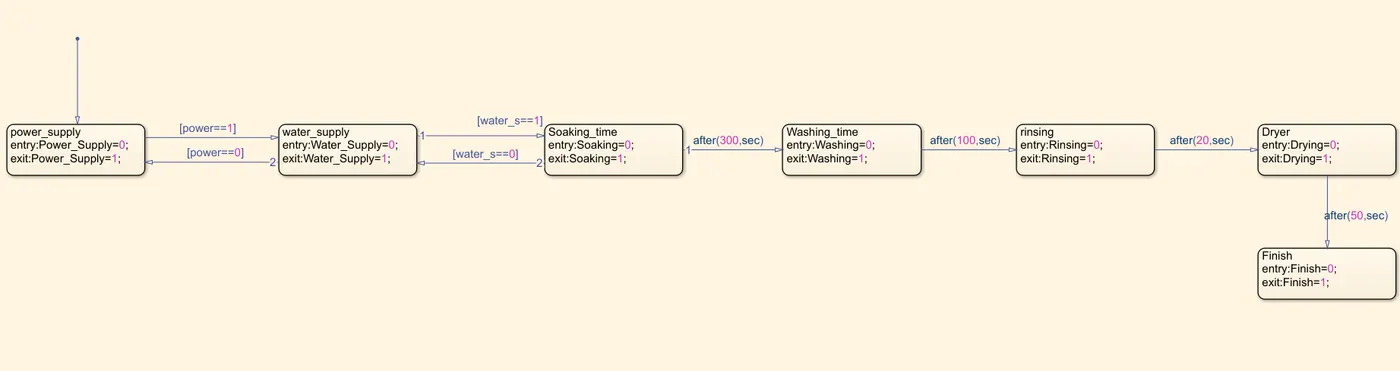
So here we need to give two inputs and get seven outputs.
Inputs- 1.power supply
2. water supply
Outputs- 1. power_supply
2.water_supply
3.soaking time
4.washing time
5.rinsing
6.dryer
7.finish
If the process output is 1 then the process is completed and zero if it is to be done.
The block diagram is as follows-
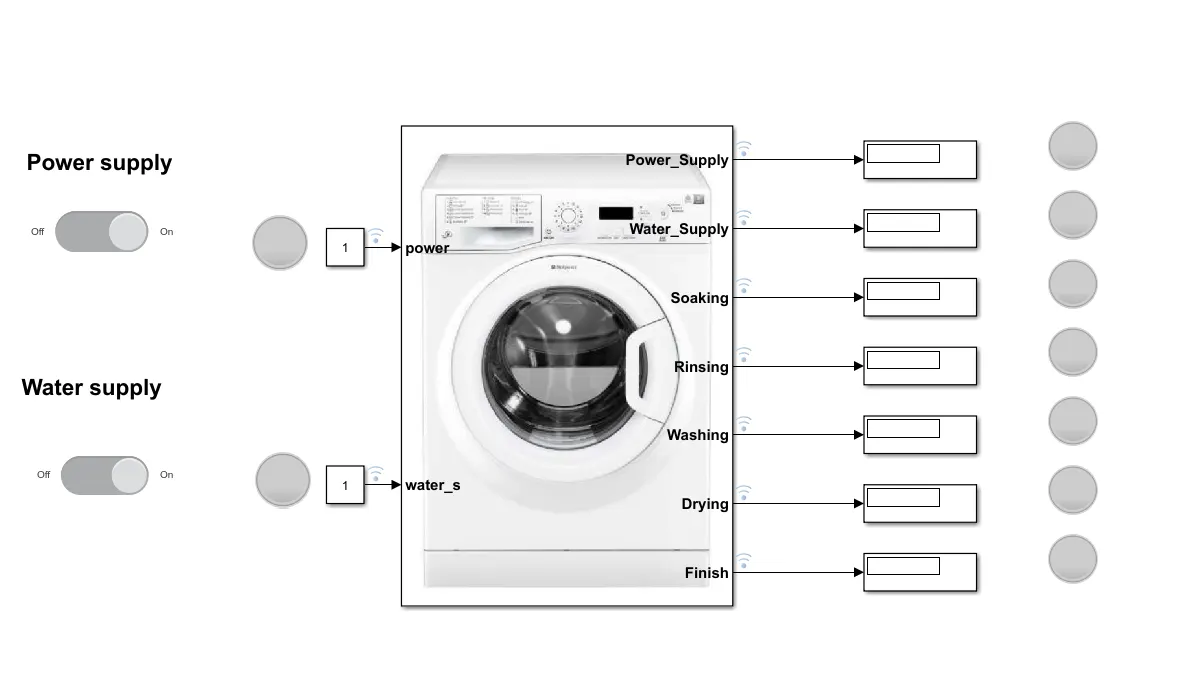
We need to connect the output ports to the display to get the result,also a lamp is connected to know wether the process is done.
The input ports are connected to slider switch ,for ON/OFF mode selection.
Lamp Connection-
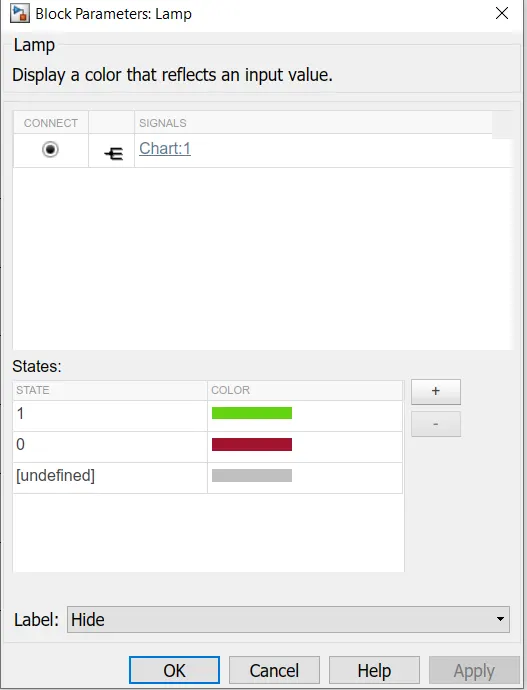
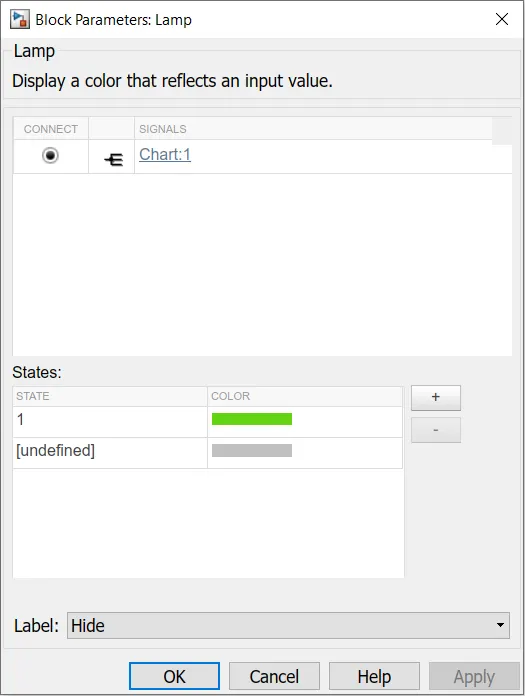
when we double click on the lamp we can set the lamp colour according to the ouput signls ,we are also required to select the input signal and click on apply.
This is done for all the other signals also.
Slider switch-
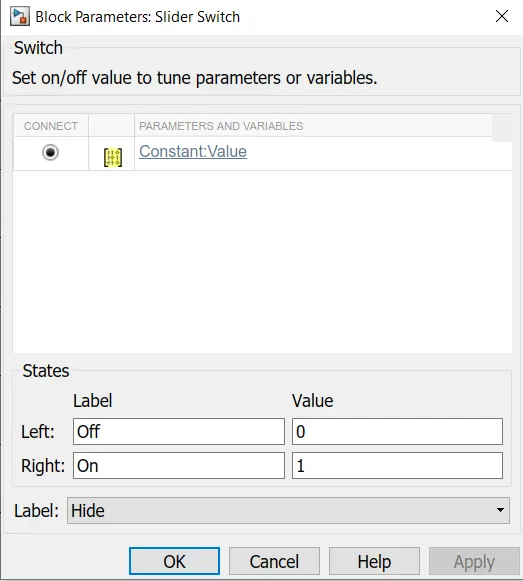
we need to select the input signal for the block and also set the labels.
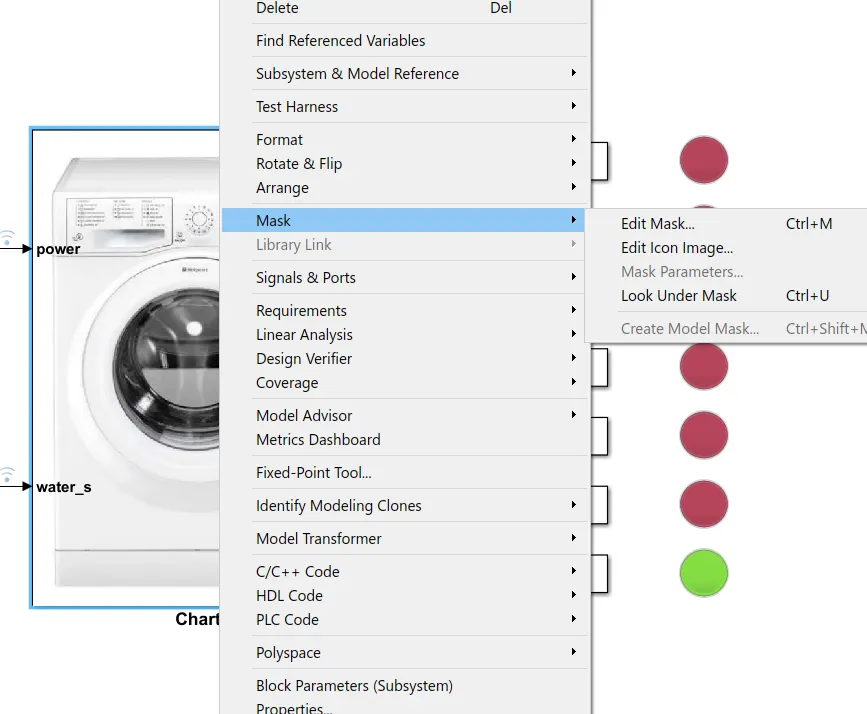
We can also give a mask picture for the chart for realistic effect .
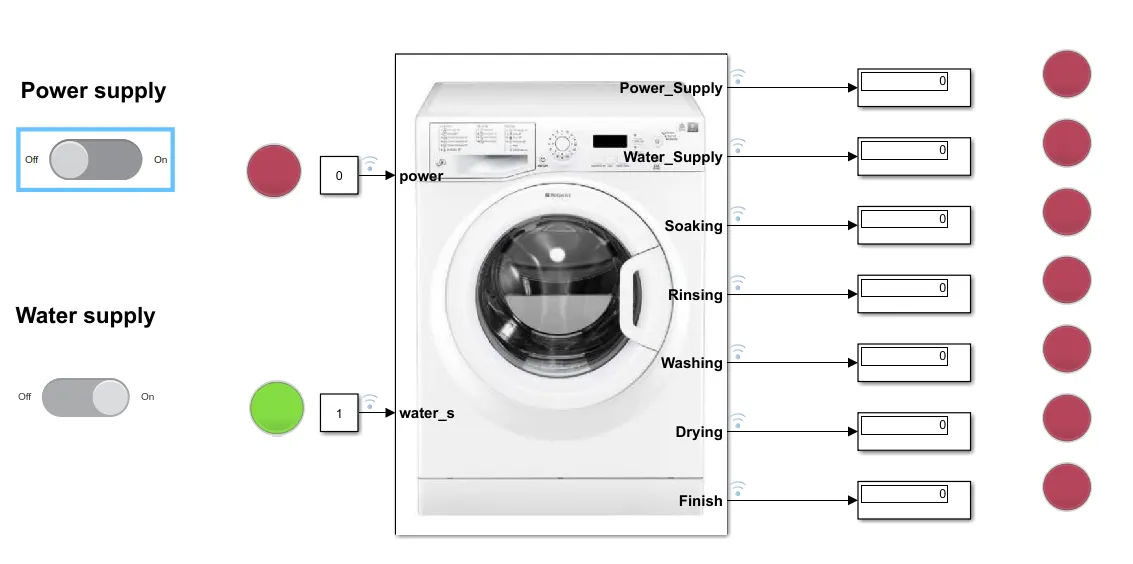
State 1 - When the power supply is OFF
In this state the process doesn't takes place.
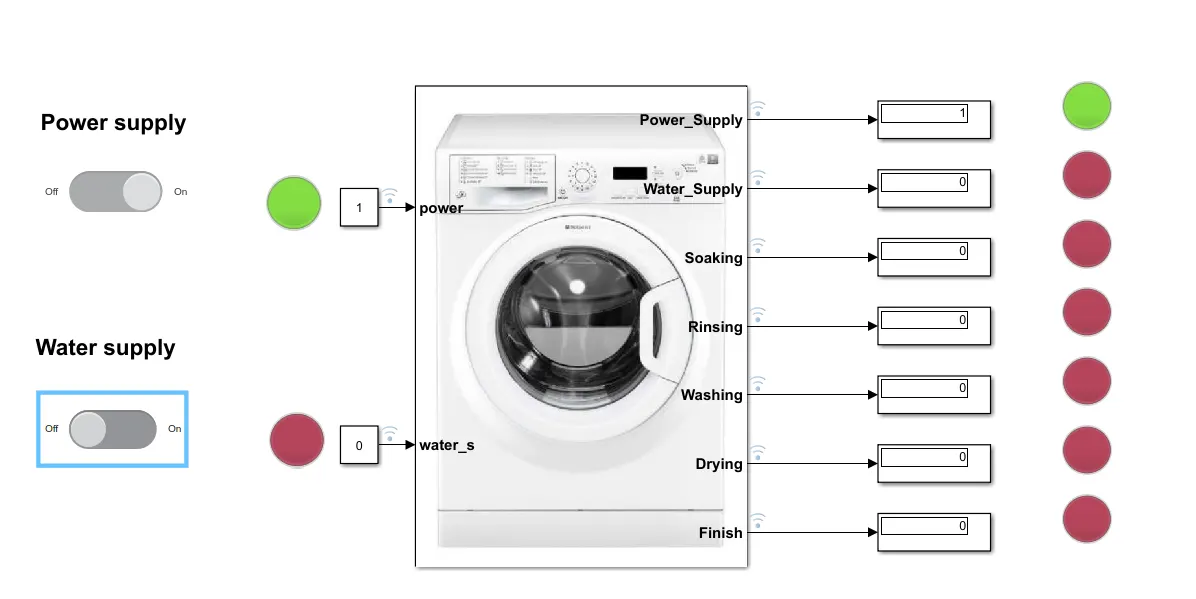
State2- When the water supply is OFF-
In this state we observe a redlight at the water supply indicating its absence
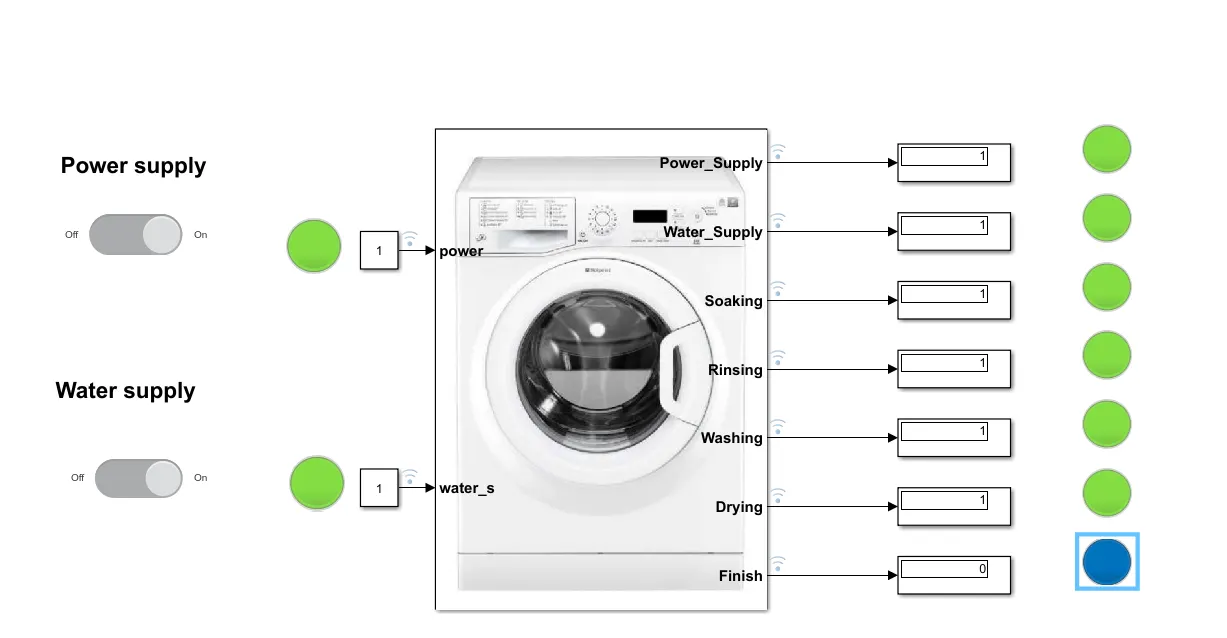
Output - Complete process
The completion of whole process is indicated by a blue light at the finsih point
STUDY 2-
AIM-
Make a Simulink chart for the “Gear shift” logic as per below conditions:
Speed Range(kmph) Gear
0 to 15 1
16 to 25 2
26 to 40 3
41 to 60 4
Above 61 5
Give speed input while the simulation is running & display the gear number.
Procedure- Now we need to create a chart and accoding to the conditions we need to design the state points where the input is speed and the output we get is gear no .so the chart is as follows.
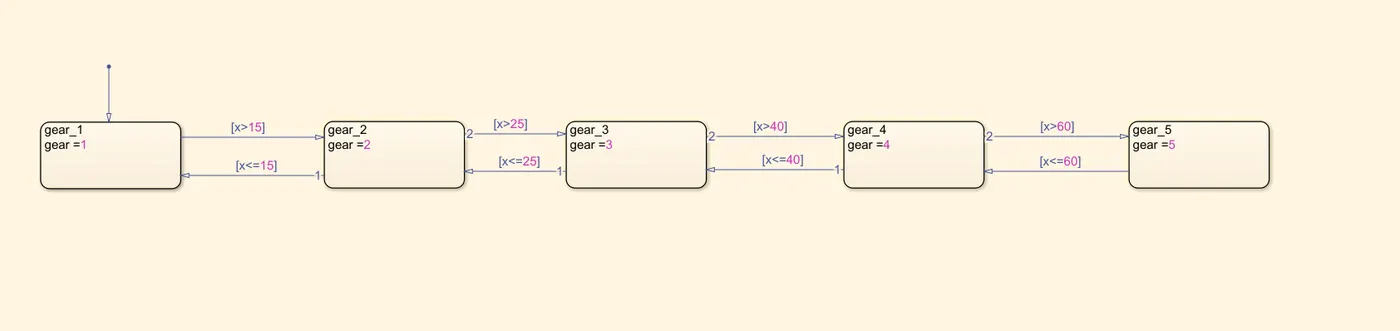
So now we need to give the input speed for which we connect the slider block and also a key block to ON/OFF the engine.We also connect lamps to indicate whic gear the vehicle is going on.
The connection is made as below-
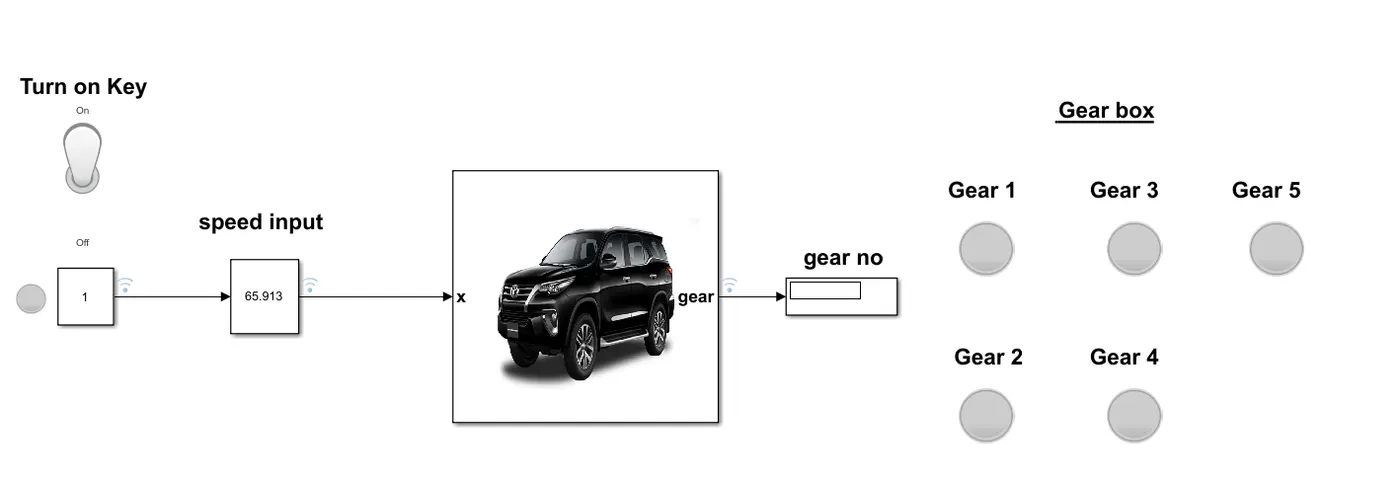
When the vehicle is ON according to the given speed input the gear of the vehicle changes.
The lamps at the gear numbers are adjusted according the ouput signal.
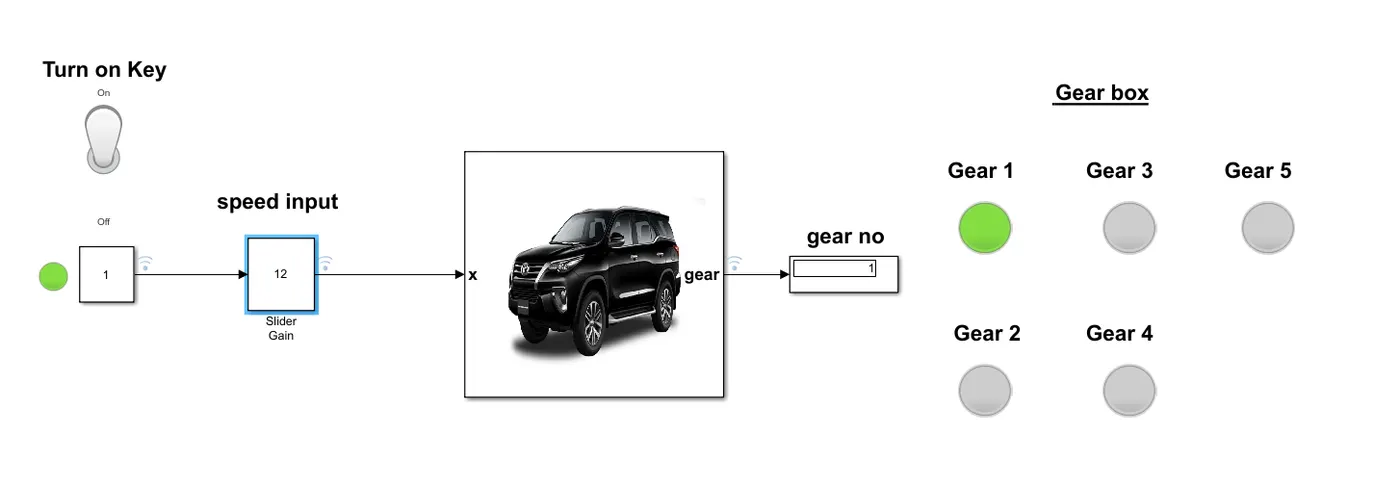
State1 - When speed is less than 15kmph-
We see here when at low speed the car is going on gear 1.
State2 - When speed is between 15 and 25kmph-
We see here when at this speed the car is going on gear 2.
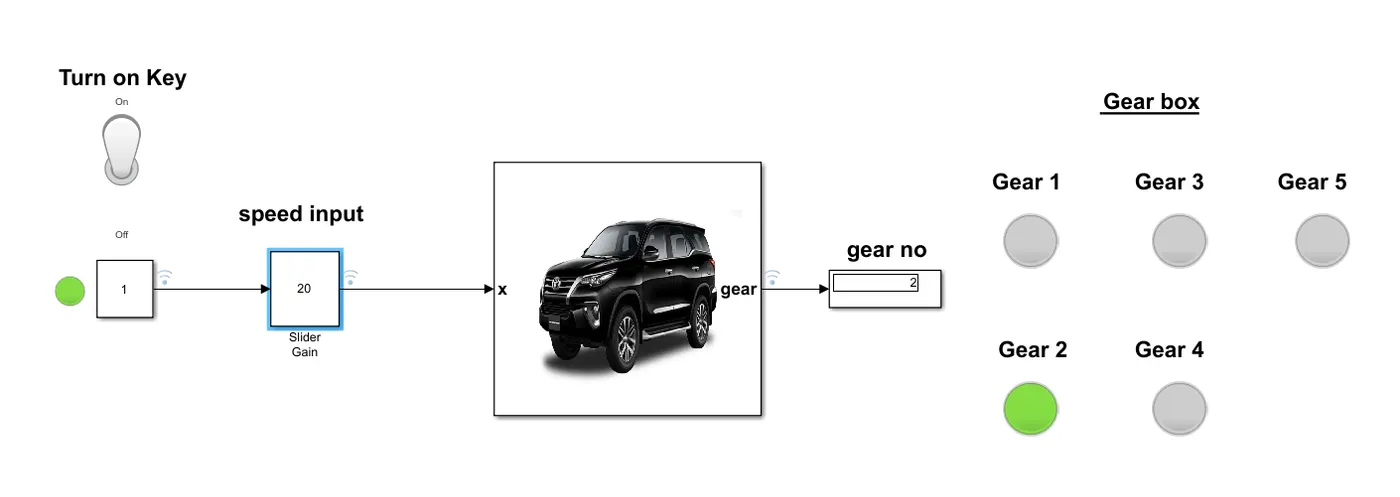
State3 - When speed is between 25 and 40 kmph-
We see here when at this speed the car is going on gear 3.
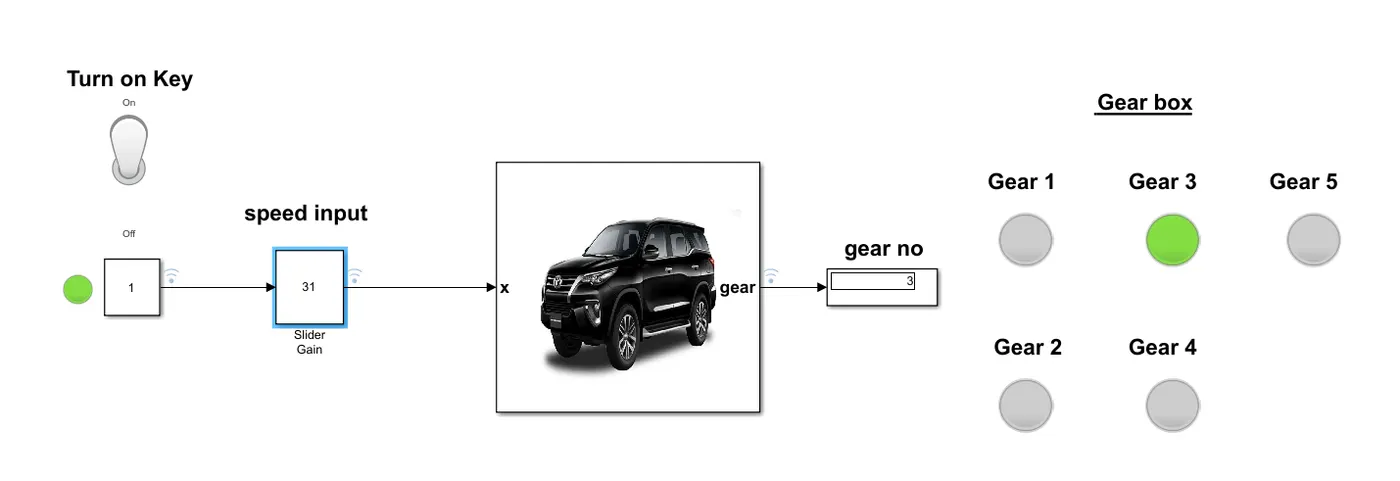
State4 - When speed is between 40 and 60 kmph-
We see here when at this speed the car is going on gear 4.
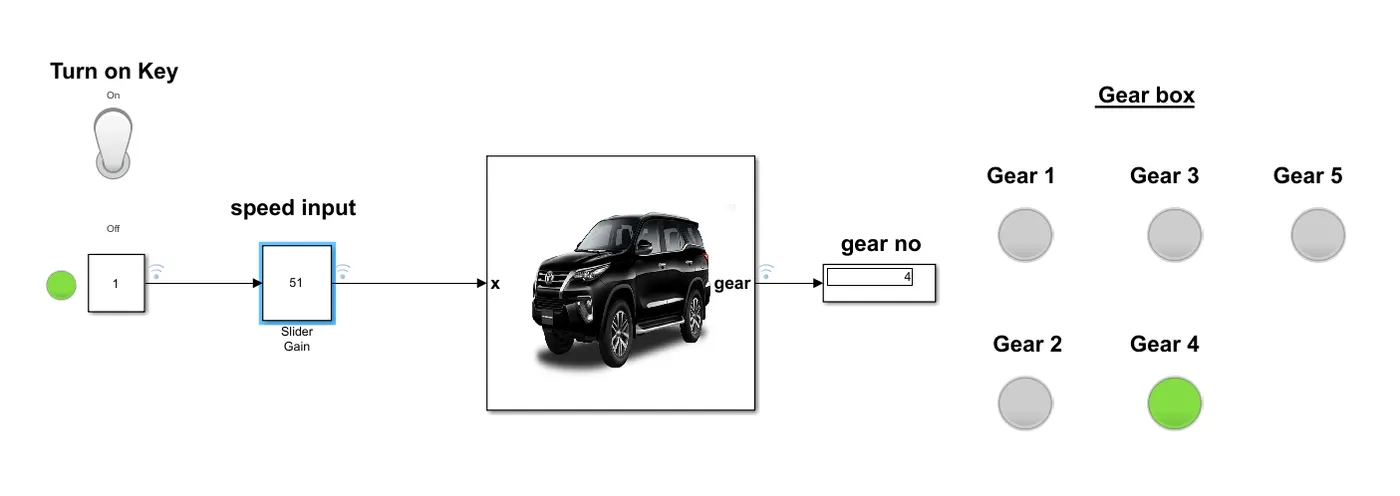
State4 - When speed is greater than 60kmph
We see here when at this speed the car is going on gear 5.
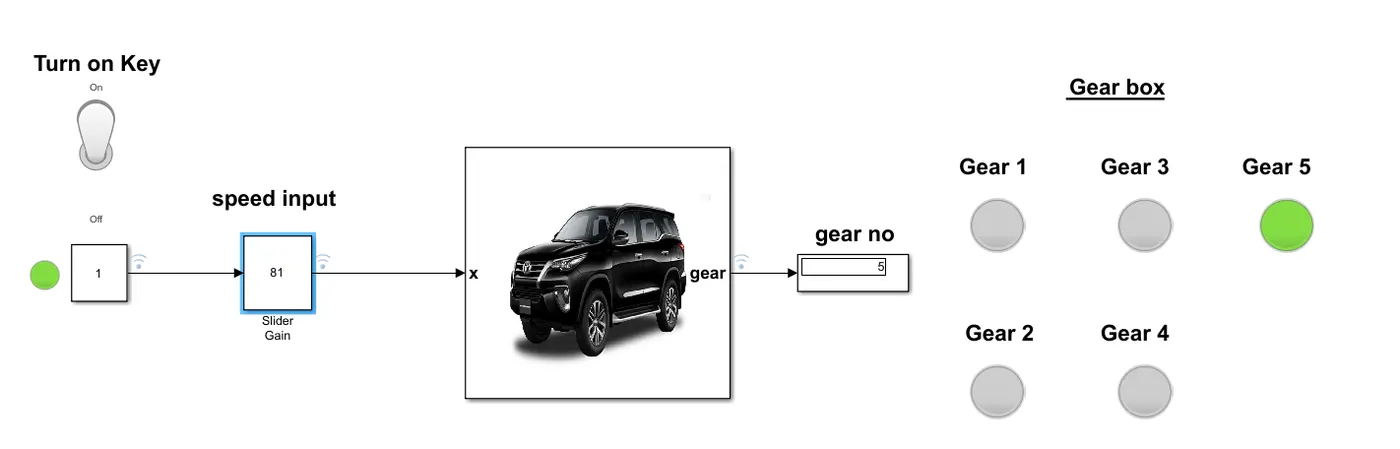
So accoding to the logic as speed of the vehicle increases the gear on which we need to drive also increases.