Simulink chart for the “Gear shift” logic
Aim :- To make a Simulink chart for the “Gear shift” logic as per given conditions
Objectives :- Following conditions are to be satisfied :-
| Speed Range(kmph) | Gear |
| 0 to 15 | 1 |
| 16 to 25 | 2 |
| 26 to 40 | 3 |
| 41 to 60 | 4 |
| Above 61 | 5 |
** Give speed input while the simulation is running & display the gear number**
Schematic Diagram :-
Blocks Used :-
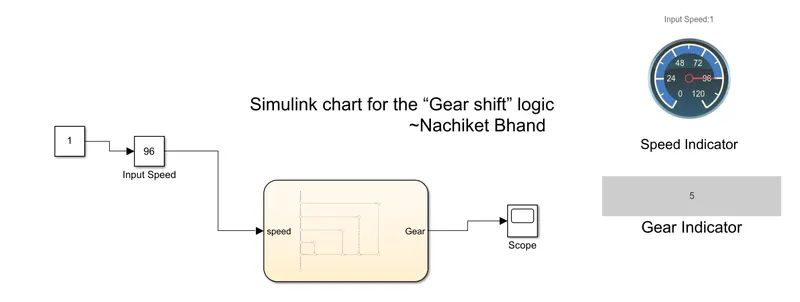
Slider Gain :- To change the input Speed value in real time simulation
Display Dashboard :- To display the Gear associated with a given speed
Scope :- To view the shift in gear w.r.t time
Chart :- To set the control logic for gear shift mechanism
Gauge :- To display the real-time input speed
Simlink model :-
Subsystem :-
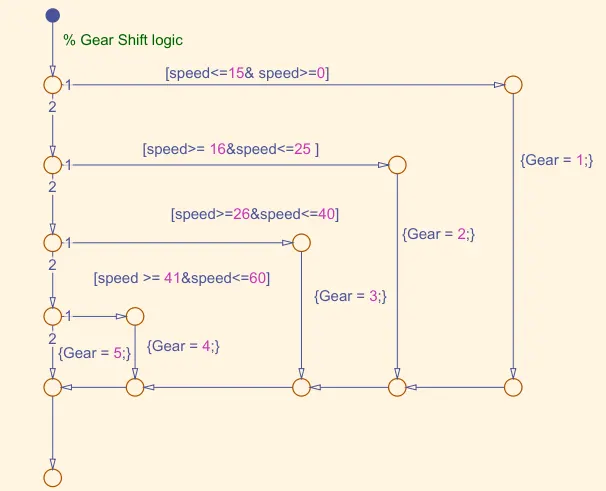
This image shows the logic for the gear change phenemenon.
Output :-
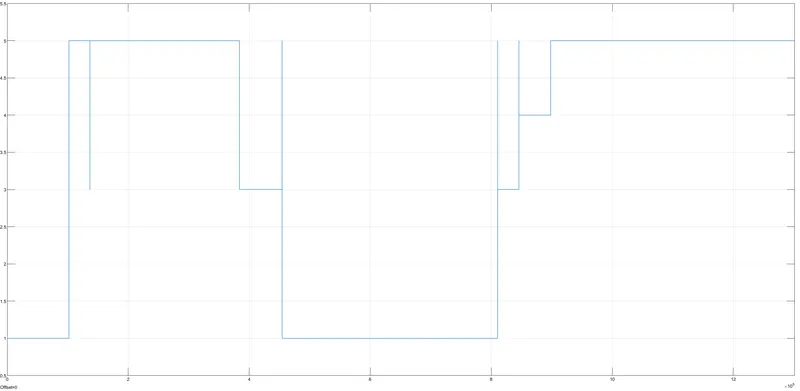
This shows the change in the gears for a time independant varying speed.
Conslusion :-
- Many automobile systems could be deigned according to the user with the help of state machine.
- The above simulation representa the real-time representation of a vehicle's gear shift paradigm