Optimization of stalagmite function with the help of genetic algorithm using MATLAB
OBJECTIVE:
1. To Understand the concept of genetic algorithm.
2. MATLAB code to optimise the stalagmite function and find the global maxima of the function.
GENETIC ALGORITHM:
A genetic algorithm is a search heuristic that is inspired by Charles Darwin’s theory of natural evolution. This algorithm reflects the process of natural selection where the fittest individuals are selected for reproduction in order to produce offspring of the next generation.[1]
Use for optimization:
Genetic Algorithm (GA) is a search-based optimization technique based on the principles of Genetics and Natural Selection. It is frequently used to find optimal or near-optimal solutions to difficult problems which otherwise would take a lifetime to solve. It is frequently used to solve optimization problems, in research, and in machine learning.[2]
In simple words, genetic algorithm is a technique to find the best possible solution of a complex problem with less time which otherwise would take a lot of time to solve with the help of traditional methods.
HOW GA WORKS?
Genetic algorithm basically divided into five following phases :
- Initial population
- Fitness function
- Selection
- Crossover
- Mutation
1.)Initial population:
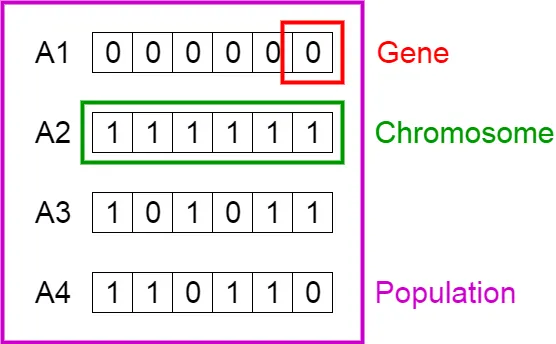
The process begins with a set of individuals which is called a Population. Each individual is a solution to the problem you want to solve.
An individual is characterized by a set of parameters (variables) known as Genes. Genes are joined into a string to form a Chromosome (solution).
In a genetic algorithm, the set of genes of an individual is represented using a string, in terms of an alphabet. Usually, binary values are used (string of 1s and 0s). We say that we encode the genes in a chromosome.
2.)Fitness function:
The fitness function determines how fit an individual is (the ability of an individual to compete with other individuals). It gives a fitness score to each individual. The probability that an individual will be selected for reproduction is based on its fitness score.
3.) Selection:
The idea of selection phase is to select the fittest individuals and let them pass their genes to the next generation.
Two pairs of individuals (parents) are selected based on their fitness scores. Individuals with high fitness have more chance to be selected for reproduction.
4.) Crossover:
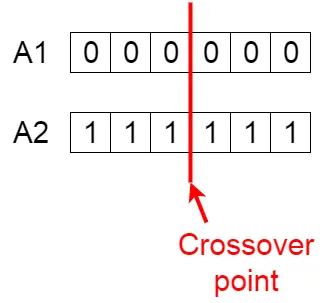
Crossover is the most significant phase in a genetic algorithm. For each pair of parents to be mated, a crossover point is chosen at random from within the genes.
For example, consider the crossover point to be 3 as shown below.
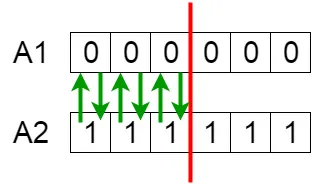
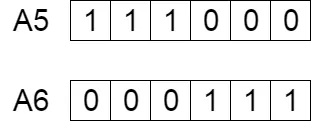
Offspring are created by exchanging the genes of parents among themselves until the crossover point is reached.
The new offspring are added to the population.
5.) Mutation:
In certain new offspring formed, some of their genes can be subjected to a mutation with a low random probability. This implies that some of the bits in the bit string can be flipped.
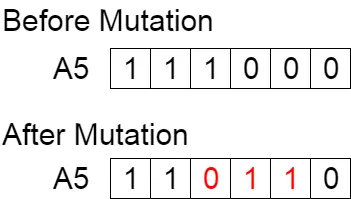
Mutation occurs to maintain diversity within the population and prevent premature convergence.[1]
SYNTAX OF GA IN MATLAB:
fins a local unconstrained minimum,x, to the objective function,function, nvars is the number of designed variables.in this program A,B, Aeq, Beq are blanks and ib and ub shows the upeer and lower bounds respectively.here options is used to replace the default parameters with modified one. (Set nonlcon=[] if no nonlinear constraints exist.)syntax which are used in the current program has been explained above.above formula is used for creating stalagmite function.
function code:
function [g] = stalagmite(input)
x = input(1);
y = input(2);

f1 =(sin(5.1*pi*x + 0.5))^6;
f2 = (sin(5.1*pi*y + 0.5))^6;
f3 = exp((-4*log(2)*(((x-0.0667)^2))/0.64));
f4 = exp((-4*log(2)*(((y-0.0667)^2))/0.64));

g = -(f1*f2*f3*f4);    % negative sign used for finding the maxima instead of minima

end
now,
OPTIMISING THE ABOVE FUNCTION AND CALCULATING GLOBAL MAXIMA USING BELOW CODE:
clear all
close all
clc

%input values
x = linspace(0,0.6,150);
y = linspace(0,0.6,150);

%coverting into 2d array
[xx, yy] = meshgrid(x,y);

num_cases = 50;

%calling stslsgmite function

for i = 1:length(x)
    for  j = 1:length(y)
        input(1) = xx(i,j);
        input(2) = yy(i,j);
        f(i,j)= stalagmite(input);
    end
end

figure(1)
surfc(xx,yy,f)

xlabel('x-value')
ylabel('y-value')
title('stalagmite function')

shading interp

[solutions] = ga(@stalagmite,2);

% study 1 - checking the result without inputs boundation
tic
for i = 1:num_cases
    [inputs, fopt(i)] = ga(@stalagmite,2);
    xopt(i) = inputs(1);
    yopt(i) = inputs(2);


end
 check_1 = toc
 figure(2)
 subplot(2,1,1)
 hold on
 surfc(x,y,f)
 title('unbounded inputs')
 xlabel('x value')
 ylabel('y value')

 shading interp
 hold on

 plot3(xopt,yopt,fopt,'marker','o','markersize',5,'markerfacecolor','m')
 subplot(2,1,2)
 plot(fopt)
 xlabel('iteration')
 ylabel('function maximum')

 % study 2 - checking result with input boundations
 tic
for i = 1:num_cases
    [inputs, fopt(i)] = ga(@stalagmite,2,[],[],[],[],[0;0],[1;1]);
    xopt(i) = inputs(1);
    yopt(i) = inputs(2);


end
 check_2 = toc
 figure(3)
 subplot(2,1,1)
 hold on
 surfc(x,y,f)
 title('bounded inputs')
 xlabel('x value')
 ylabel('y value')

 shading interp
 hold on

 plot3(xopt,yopt,fopt,'marker','o','markersize',5,'markerfacecolor','m')
 subplot(2,1,2)
 plot(fopt)
 xlabel('iteration')
 ylabel('function maximum')

 % study 3 checking the result by increasing ppulation size with input
 % boundation

 % increase the population size to 170
 options = optimoptions('ga');
 options = optimoptions(options,'populationsize',170);    %by default ga consider 50 set of population size


  tic
for i = 1:num_cases
    [inputs, fopt(i)] = ga(@stalagmite,2,[],[],[],[],[0;0],[1;1],[],[],options);
    xopt(i) = inputs(1);
    yopt(i) = inputs(2);


end
 check_3 = toc
 figure(4)
 subplot(2,1,1)
 hold on
 surfc(x,y,f)
 title('bounded inputs with increase population')
 xlabel('x value')
 ylabel('y value')

 shading interp
 hold on

 plot3(xopt,yopt,fopt,'marker','o','markersize',5,'markerfacecolor','m')
 subplot(2,1,2)
 plot(fopt)
 xlabel('iteration')
 ylabel('function maximum')

 global_maxima = fopt;
EXPLANATION OF THE ABOVE CODES:
1.) First of all, code for stalagmte function is created:
a) a stalagmite function is created having inputs as a variable.
b) x and y variables are defiend for different value of inputs and the above shown formula is used.
2.) another code is created to optimize stalagmite function and to find global maxima:
- first of all, x and y variables are defiend having value between 0 and 0.6 divided into 150 terms using linspace command.
- a variable of num_cases having 50 value is assigned for the iterations i.e ga will run for the 50 times.
- 2d array is created using meshgrid command from x and y variables.
- two for loops are used to eavaluate stalagmite function as shown in the code.
- output of function is stored in 2d form in f variable
- now plotting the 3d plot using surfc command.
- shading interp is used to smooth the shades.
- after that, tic command is used for starting the timer.
- now for loop for the iterations is created.
- now for first study which is without any input boundations using simple gentic algorithm syntax
- as negative sign is used in the stalagmite function so ga will give the maximum output for each iteration.
- toc command is used to stop the timer.
- then figure(1) is created in which stalagmite 3d plot created usinf surfc command and two sub plots are created.
- in ist subplot, plot of xopt, yopt, and fopt are plotted showing by a marker dot.
- another plot of fopt is created.
- after obvserving the plot it has been found that the maximum value varies each time of the execution of the program so, that is where study 2 comes in.
- in next study, the whole code is same except the syntax of ga is different as in this study input is bounded so that is why different syntax is used for input boundations.
- the variation of maximum value of study 2 is lesser than study 1 but still varying greatly.
- The 3rd study is same as the previous one but the difference is that the intial population size is increased to 170.
- so after study 3 it has been found that the maxima is stll varying but in between small limits.
ERROR FACED:
Only minor typing error were faced which were easly tackled as matlab is smart enough to notify these type of errors immediately.
OUTPUT:
Plot of stalagmite function:
study 1 without input boundation:
plot:
time taken in seconds:
study 2 with input boundation:
plot:
Time taken:
study 3 increased population with input boundations:
plot:
Time taken:
REFRENCES:
2.https://www.tutorialspoint.com/genetic_algorithms/genetic_algorithms_introduction.htm
3.https://en.wikipedia.org/wiki/Genetic_algorithm
4.https://in.mathworks.com/help/gads/ga.html#mw_a9a9e523-4242-481e-b6b9-acbe194a2432