Project - Data Handling and Interpolation
%Basic MATHLAB Project
%Author: Ricardo Nunes
%Date - 4th Aug 22
%Start
% Reading experimental Voltage - Current data contained in the excel sheet called
% VI.xlsx
VI_Data = xlsread('VI.xlsx');
% Seperating Volatage and Current data into 2 seperate arrays
V_Data = VI_Data(:,1);
I_Data = VI_Data(:,2);
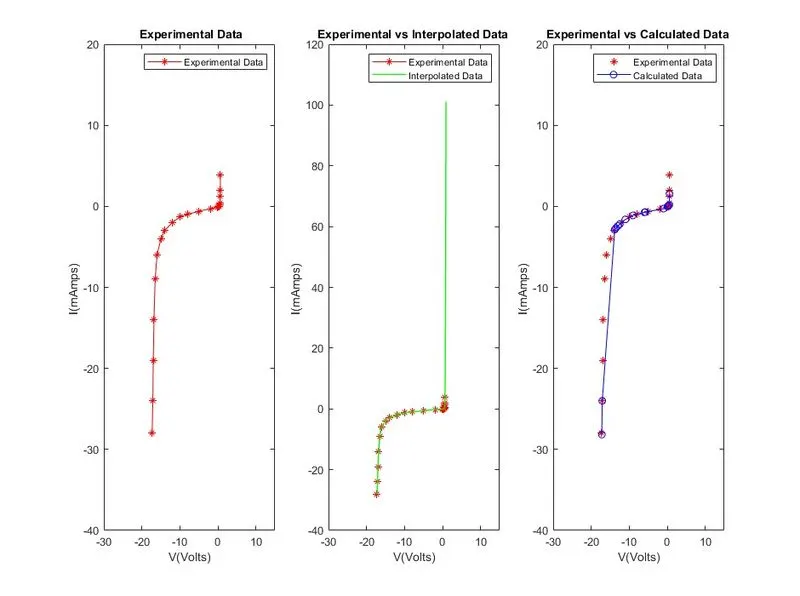
%Plotting experimental data
f = figure;
f.Position = [100 100 940 700]; %Sets the size of the Plot window
subplot(1,3,1) %Left most plot
plot(V_Data,I_Data,'r','marker','*');
legend('Experimental Data')
xlabel('V(Volts)')
ylabel('I(mAmps) ')
title(" Experimental Data")
axis([-30 15 -40 20]);
% Interpolating current data I_Interp for a range of Voltage data given i.e.
% V_Range using experimental data
V_Range = [-17.3:0.1:0.9];
I_Interp = interp1(V_Data,I_Data,V_Range,'spline');
% interp1 interpolates to find I_Interp using the values of function I_Data = F(V_Data) at
% query points V_range using piecewise cubic spline interpolation
% Plotting Interpolated Current vs Voltage and comparing it with
% experimental data of V vs I
subplot(1,3,2) %Center plot
plot(V_Data,I_Data,'r','marker','*');hold on;
plot(V_Range,I_Interp,'g','LineWidth',1)
legend('Experimental Data','Interpolated Data')
xlabel('V(Volts)')
ylabel('I(mAmps) ')
title('Experimental vs Interpolated Data ')
axis([-30 15 -40 120]);
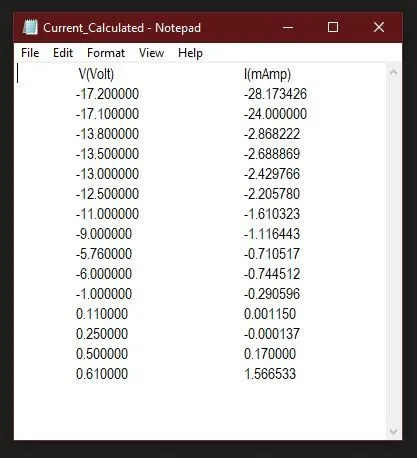
% The next task is to calculate current(I_Calculated) using some given Voltage data
% stored in V_Given. This is done using spline interp1 method too
V_Given = [-17.2 -17.1 -13.8 -13.5 -13.0 -12.5 -11 -9 -5.76 -6 -1 0.11 0.25 0.5 0.61]'
I_Calculated = interp1(V_Data,I_Data,V_Given,'spline')
% Plotting Calculated Current vs given Voltage and comparing it with
% experimental data of V vs I
subplot(1,3,3)%Right most plot
plot(V_Data,I_Data,'r','linestyle','none','marker','*');hold on;
plot(V_Given,I_Calculated,'b','marker','o');
legend('Experimental Data','Calculated Data')
xlabel('V(Volts)')
ylabel('I(mAmps) ')
title('Experimental vs Calculated Data ')
axis([-30 15 -40 20]);
%Storing the Calculated Current and given voltages in a text file
data = [V_Given I_Calculated]; % combining the given voltage and calculated current arrays into a single data matrix
fid = fopen('Current_Calculated.txt','w'); %Creating a Current_Calculated text file in write mode
fprintf(fid,'\t V(Volt) \t\t\t I(mAmp)\n');% First Line
% extracting individual elements from each of the 2 colums and adding it to the texrt file in consecutive lines
for i = 1:length(V_Given)
fprintf(fid,'\t %f \t\t %f \n',data(i,1),data(i,2));
end
fclose(fid);
%End
Running this script will give the following plot :
And the text file is as follows :