Project - Data Handling and Interpolation
*MATLAB CODE*
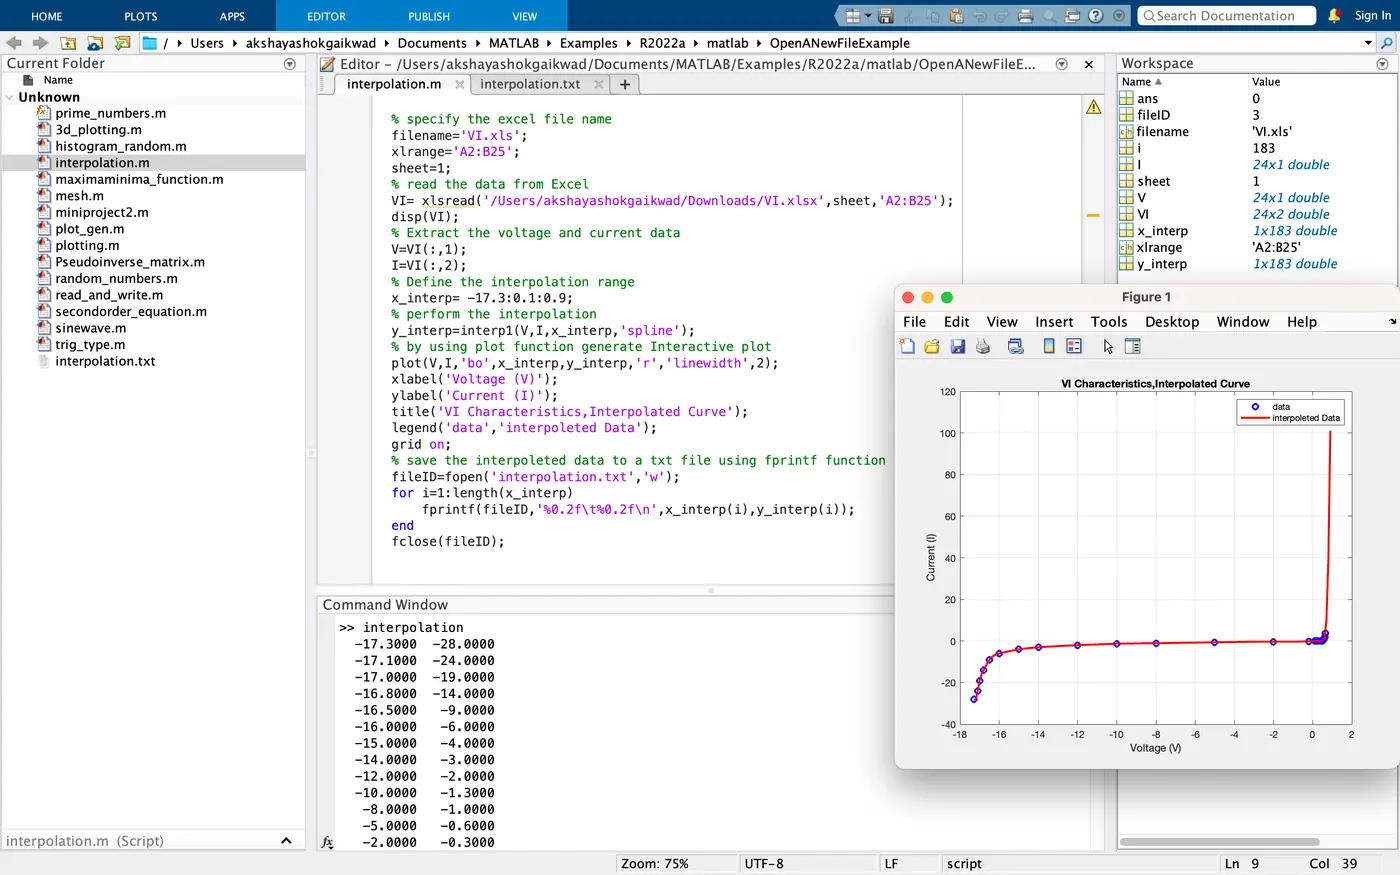
% specify the excel file name
filename='VI.xls';
xlrange='A2:B25';
sheet=1;
% read the data from Excel
VI= xlsread('/Users/akshayashokgaikwad/Downloads/VI.xlsx',sheet,'A2:B25');
disp(VI);
% Extract the voltage and current data
V=VI(:,1);
I=VI(:,2);
�fine the interpolation range
x_interp= -17.3:0.1:0.9;
% perform the interpolation
y_interp=interp1(V,I,x_interp,'spline');
% by using plot function generate Interactive plot
plot(V,I,'bo',x_interp,y_interp,'r','linewidth',2);
xlabel('Voltage (V)');
ylabel('Current (I)');
title('VI Characteristics,Interpolated Curve');
legend('data','interpoleted Data');
grid on;
% save the interpoleted data to a txt file using fprintf function
fileID=fopen('interpolation.txt','w');
for i=1:length(x_interp)
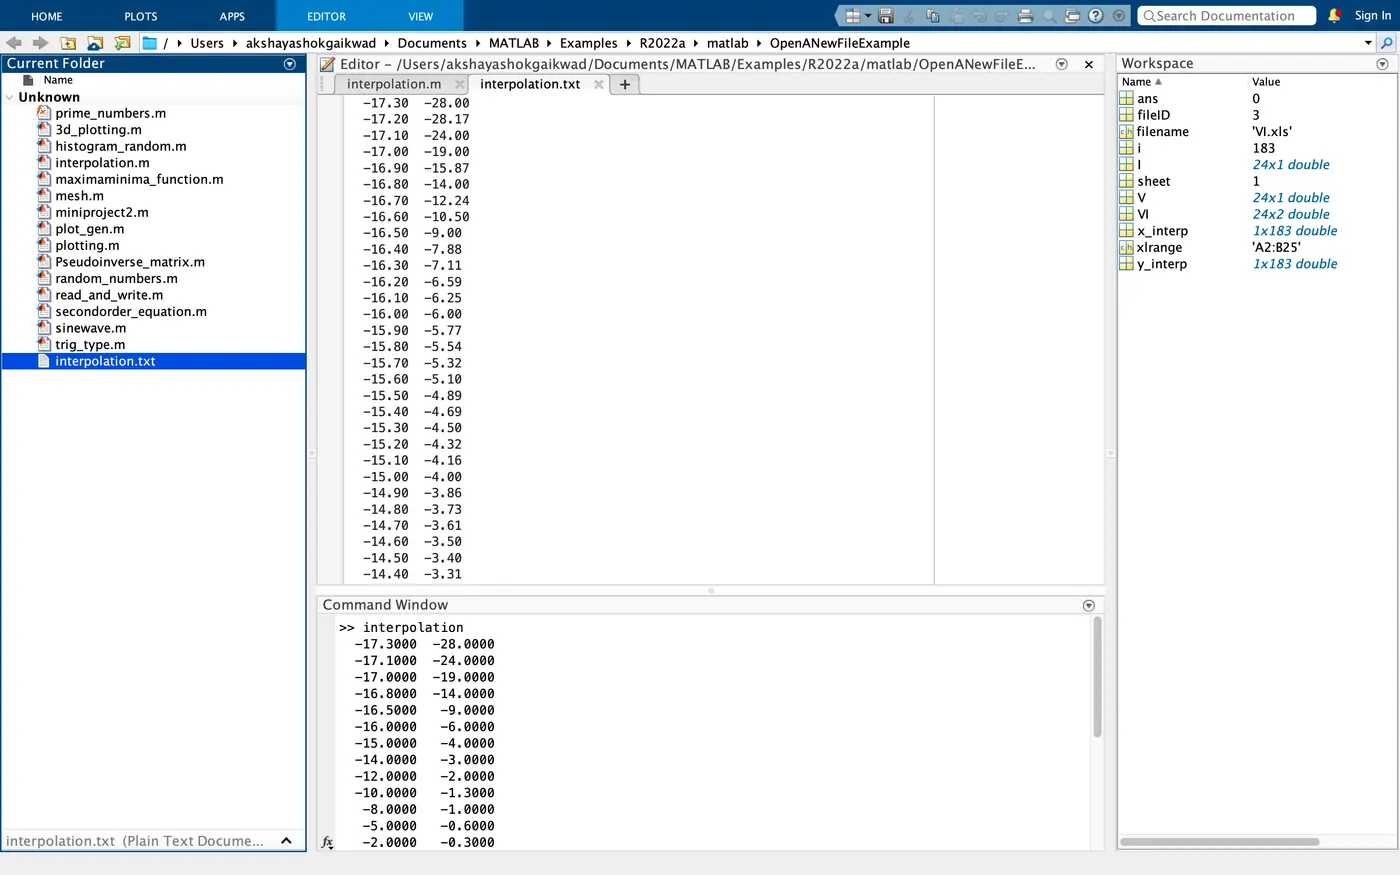
fprintf(fileID,'%0.2f\t%0.2f\n',x_interp(i),y_interp(i));
end
fclose(fileID);
*RESULT*
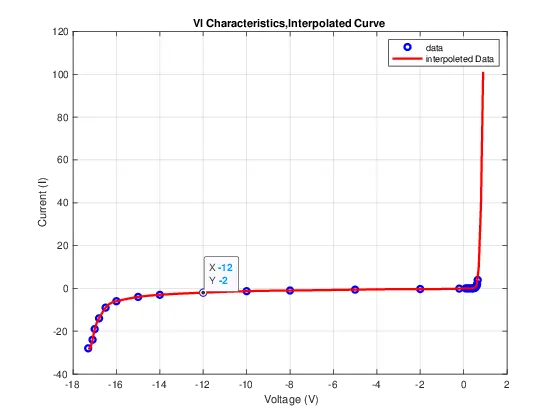
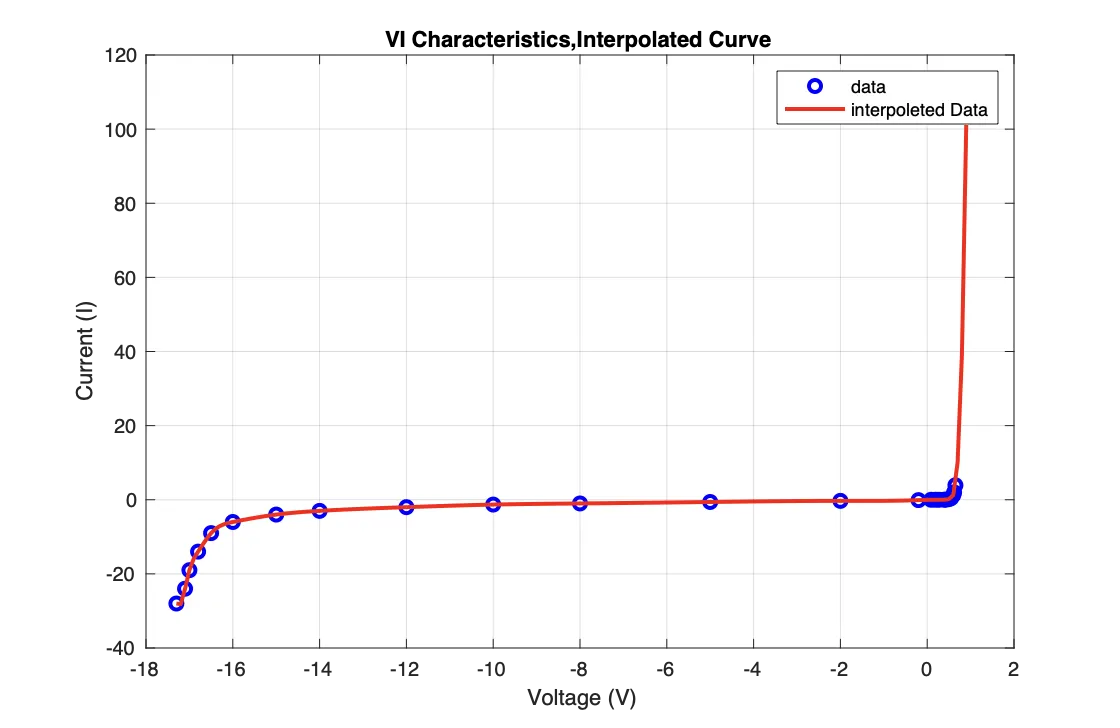
- plot shows VI Characteristics,interpolted curve
- Blue dot data shows original from VI.xlsx file
- Red line is the interpolated data
*CONCLUSION*
- the above file interpolated.m has been attached
- the above txt file interpolated.txt has been attached