Project - Data Handling and Interpolation
Project:
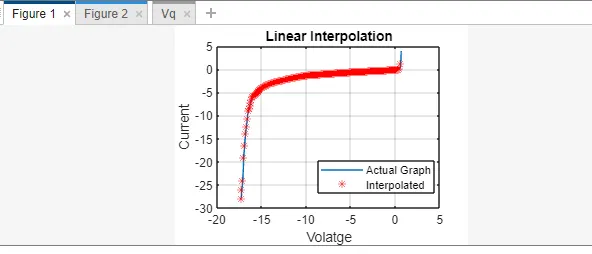
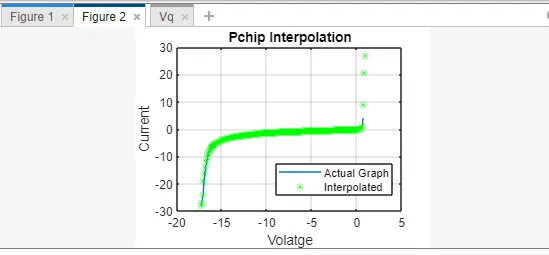
Read the excel file in the Matlab program and perform the interpolation in the range of -17.3:0.1:0.9. Generate the interactive plot for the interpolated data and store them in a text file
code:
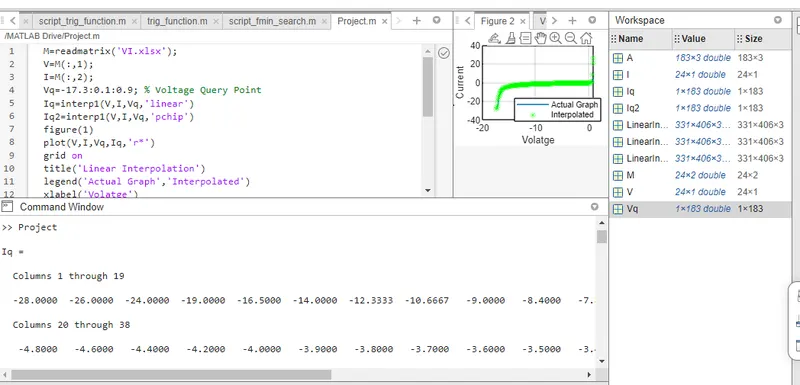
M=readmatrix('VI.xlsx');
V=M(:,1);
I=M(:,2);
Vq=-17.3:0.1:0.9; % Voltage Query Point
Iq=interp1(V,I,Vq,'linear')
Iq2=interp1(V,I,Vq,'pchip')
figure(1)
plot(V,I,Vq,Iq,'r*')
grid on
title('Linear Interpolation')
legend('Actual Graph','Interpolated')
xlabel('Volatge')
ylabel('Current')
figure(2)
plot(V,I,Vq,Iq2,'g*')
grid on
title('Pchip Interpolation')
legend('Actual Graph','Interpolated')
xlabel('Volatge')
ylabel('Current')
%%
A=[Vq' Iq' Iq2']
writematrix(A,'Project output.txt')
/*************************************************/
Figures: