Project - Data Handling and Interpolation
PROJECT
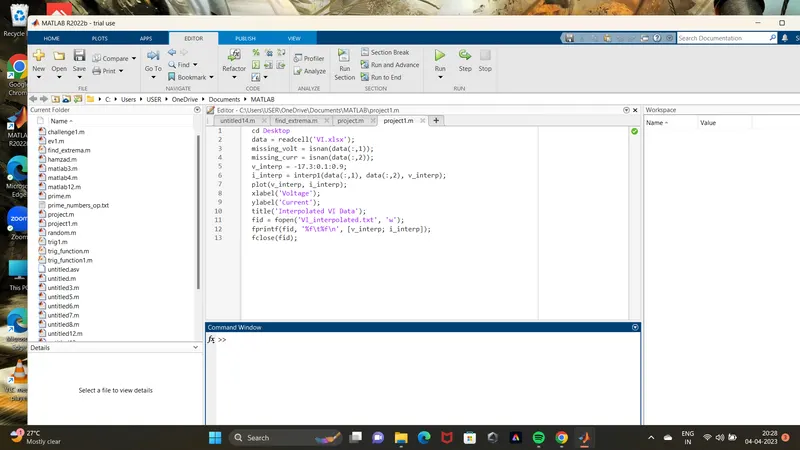
missing_volt = isnan(data(:,1));
This will create a logical array "missing_volt" where the value is 1 for missing data points and 0 for non-missing data points in the voltage column. Similarly, check for missing data points in the current column using the following command:
missing_curr = isnan(data(:,2));
4. Using the "fillmissing" function to fill in any missing data points with interpolated values. For example, to fill in missing data points in the voltage column with linear interpolation, using the following command:
data(:,1) = fillmissing(data(:,1), 'linear');
Similarly, to fill in missing data points in the current column with linear interpolation, using the following command:
data(:,2) = fillmissing(data(:,2), 'linear');
5. Using the "interp1" function to perform interpolation on the data. For example, to interpolate the data for the range -17.3:0.1:0.9, using the following command:
v_interp = -17.3:0.1:0.9;
i_interp = interp1(data(:,1), data(:,2), v_interp);
This will interpolate the current data in the "data" variable based on the voltage values and store the interpolated data in the "i_interp" variable.
6. Using the "plot" function to generate an interactive plot for the interpolated data. For example, using the following command:
plot(v_interp, i_interp);
xlabel('Voltage');
ylabel('Current');
title('Interpolated VI Data');
This will generate an interactive plot for the interpolated data, with the voltage values on the x-axis and the interpolated current values on the y-axis.
7.Using the "fprintf" function to store the interpolated data in a text file. For example, using the following command:
fid = fopen('VI_interpolated.txt', 'w');
fprintf(fid, '%f\t%f\n', [v_interp; i_interp]);
fclose(fid);
This will create a text file named "VI_interpolated.txt" and store the interpolated data in it, with the voltage values in the first column and the interpolated current values in the second column, separated by a tab.
I dont get the output.