Project - Data Handling and Interpolation
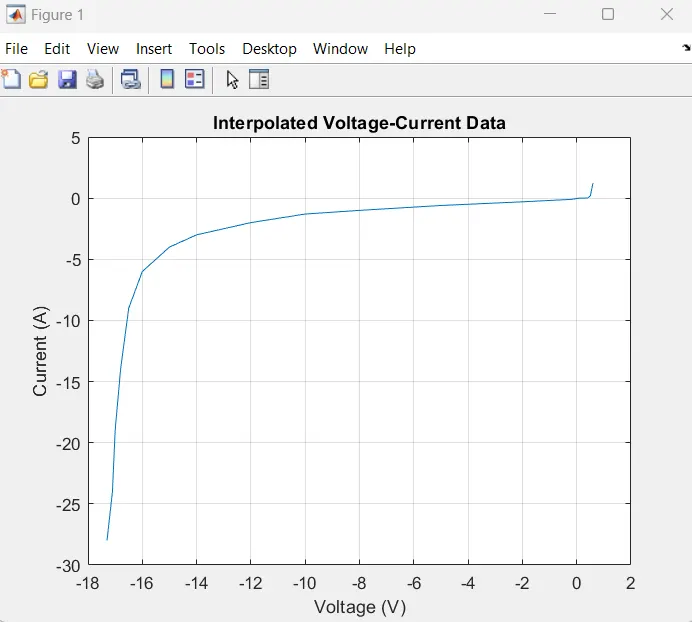
In a laboratory experiment, data of voltage and current has been recorded and the same is attached in an excel file ( Click on this link VI.xlsx ). Read the excel file in the Matlab program and perform the interpolation in the range of -17.3:0.1:0.9. Generate the interactive plot for the interpolated data and store them in a text file.
Ans:
% Load the data from the Excel file
data = readtable('VI.xlsx');
% Extract the voltage and current data
V = data{:,1};
I = data{:,2};
% Find missing data and interpolate
idx = find(isnan(I));
I_interp = interp1(V(~isnan(I)), I(~isnan(I)), V(idx));
% Interpolate the data set
V_interp = -17.3:0.1:0.9;
I_interp = interp1(V, I, V_interp);
% Generate an interactive plot for the interpolated data
figure;
plot(V_interp, I_interp);
xlabel('Voltage (V)');
ylabel('Current (A)');
title('Interpolated Voltage-Current Data');
grid on;
% Save interpolated data to a text file
interpolated_data = [V_interp', I_interp'];
dlmwrite('interpolated_data.txt', interpolated_data, 'delimiter', '\t');