Project - Data Handling and Interpolation
MATLAB Code -
% readcell command will read and store the data into cell array in matlab
Voltage = readcell('VI.xlsx','sheet','1','range','A2:A25');
current = readcell('VI.xlsx','sheet','1','range','B2:B25');
% cell2mat command is used to create a vector to plot
v = cell2mat(Voltage);
I = cell2mat(current);
% plotting of a current data using plot command
plot(v,I);grid;
% lets interpolate the given range on data and find out second var value...
...from that
Vi = -17.3:0.1:0.9; % given range for the interpolation
Ii = interp1(v,I,Vi); % interp1 command is used to perform inteerpolation
% plotting using plot command is done for new data obtained by the given range
plot(v,I,'k',Vi,Ii,'*');grid; % k and * is used for graphical representation
xlabel('Voltage in V');
ylabel('current in A');
legend('Provided data','Data obtained using interpolation');
% To store the interpolated data writematrix function is used
writematrix(Vi,'interpolated_data.txt');
writematrix(Ii,'interpolated_data.txt','writemode','append'); % two arguments...
... writemode and append will appending a data of Ii obtained through interpolation ...
...into same text file from a new line.
Output plot -
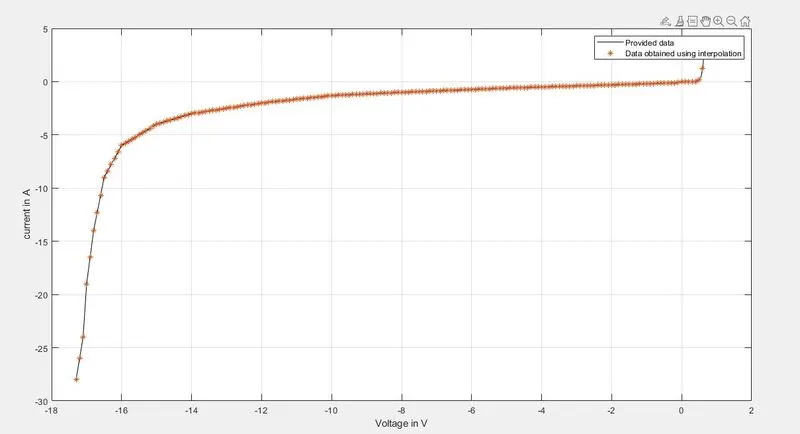
NOTE - Matlab file named 'Projetc_1.m' as well as text file named 'Interpolated_data.txt' is attached for the reference