Project - Data Handling and Interpolation
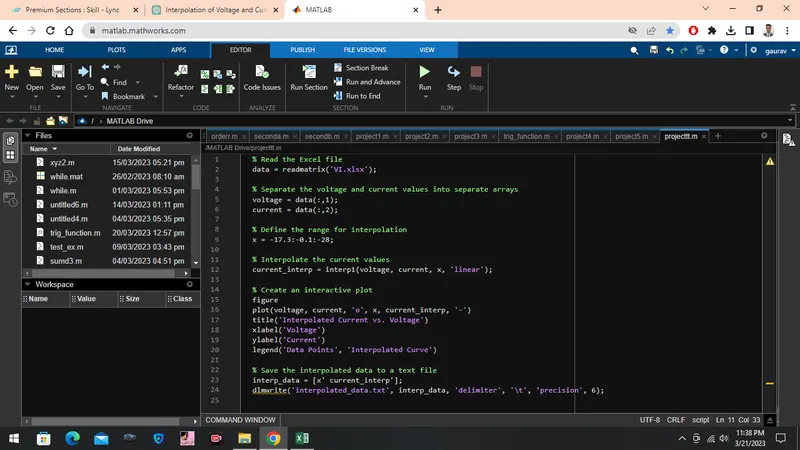
% Read the Excel file
data = readmatrix('VI.xlsx');
% Separate the voltage and current values into separate arrays
voltage = data(:,1);
current = data(:,2);
% Define the range for interpolation
x = -17.3:-0.1:-28;
% Interpolate the current values
current_interp = interp1(voltage, current, x, 'linear');
% Create an interactive plot
figure
plot(voltage, current, 'o', x, current_interp, '-')
title('Interpolated Current vs. Voltage')
xlabel('Voltage')
ylabel('Current')
legend('Data Points', 'Interpolated Curve')
% Save the interpolated data to a text file
interp_data = [x' current_interp'];
dlmwrite('interpolated_data.txt', interp_data, 'delimiter', '\t', 'precision', 6);