Project - Data Handling and Interpolation
Project :
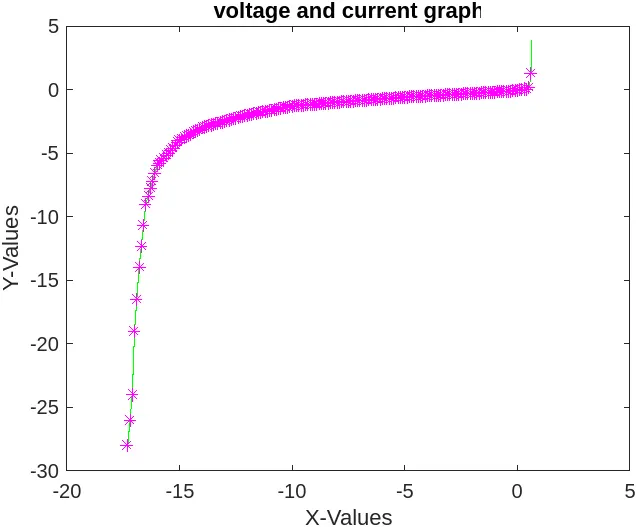
In a laboratory experiment, data of voltage and current has been recorded and the same is attached in an excel file ( Click on this link VI.xlsx ). Read the excel file in the Matlab program and perform the interpolation in the range of -17.3:0.1:0.9. Generate the interactive plot for the interpolated data and store them in a text file.
MATLAB CODE:
d = readmatrix('VI.xlsx');
v = d(:,1);        % fetch voltage data from d variable
i = d(:,2);        % fetch voltage data from d variable
x =  -17.3:0.1:0.9; % x is a variable that ranges from -17.3 to 0.9
y = interp1(v,i,x); % y is a interpolation variable
plot(v,i,'g',x,y,'m*') % plot is a command to plot the curve
iv = [-17.2            % iv is interpolated voltage
    -13
    -9
    -6
    -1
    0.11
    0.25
    0.5
    0.61
    0.66];
ii=interp1(v,i,iv);    % ii is interpolated current
z=[iv ii];
filename=fopen('last_one.txt','w');
fprintf(filename,'%f %f\n','iv','ii');
fclose(filename);
MISSING DATA:
105.000000 118.000000
105.000000 105.000000
RESULTS: