Project - Data Handling and Interpolation
1.In a laboratory experiment, data of voltage and current has been recorded and the same is attached in an excel file ( Click on this link VI.xlsx ). Read the excel file in the Matlab program and perform the interpolation in the range of -17.3:0.1:0.9. Generate the interactive plot for the interpolated data and store them in a text file.
PROGRAM
clc
clear all
%input
data= xlsread('VI.xlsx')
v=data(:,1)
i=data(:,2)
%given range
v1=-17.3:0.1:0.9;
%Linear Interpolation
ix1=interp1(v,i,v1)
%Spline Interpolation
ix2=interp1(v,i,v1,"spline");
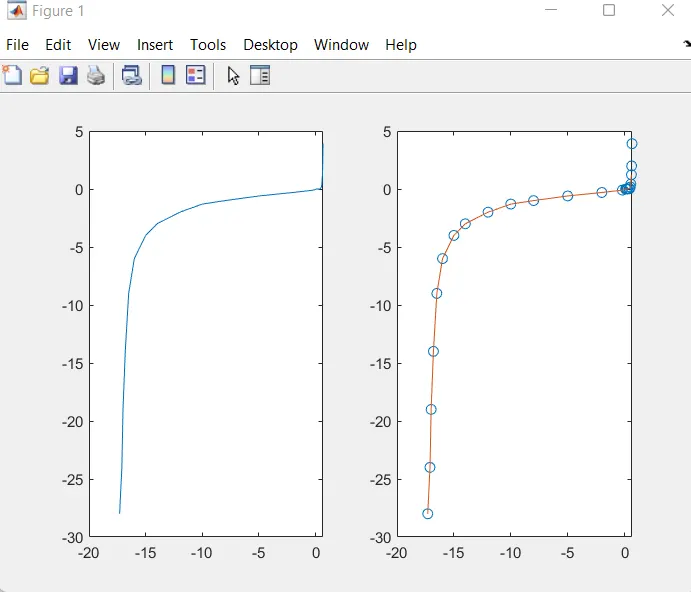
%ploting Linear Interpolation
figure (1)
plot(v,i,'o',v1,ix1)
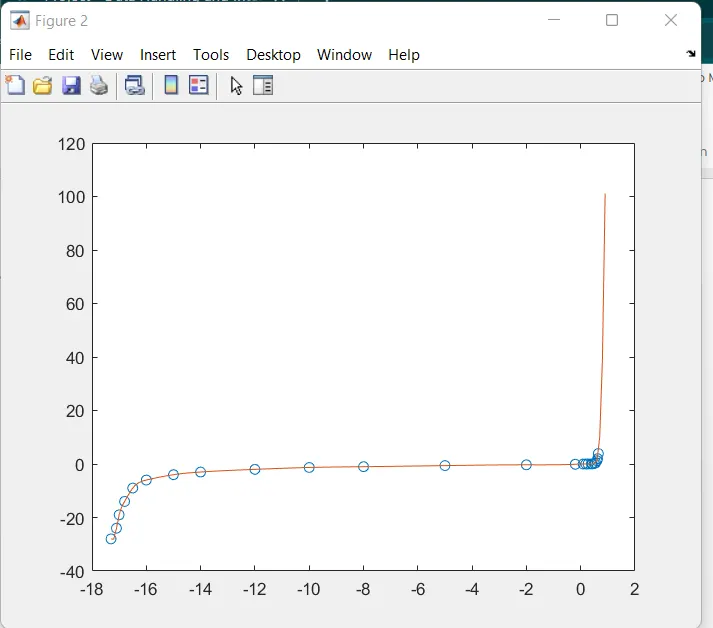
%ploting Spline Interpolation
figure (2)
plot(v,i,'o',v1,ix2)
%To find value of current
%new input voltage
v12=[-17.5,-17.0,-16.9,-16.4,-16.1,-15.9,-15.5,-14.8,-13.5,-12.5,11.3,-11.0,-7.0,-5.23,-4.23,-2.36,-2.0,-1.2,0.18,0.28,0.40,0.45]
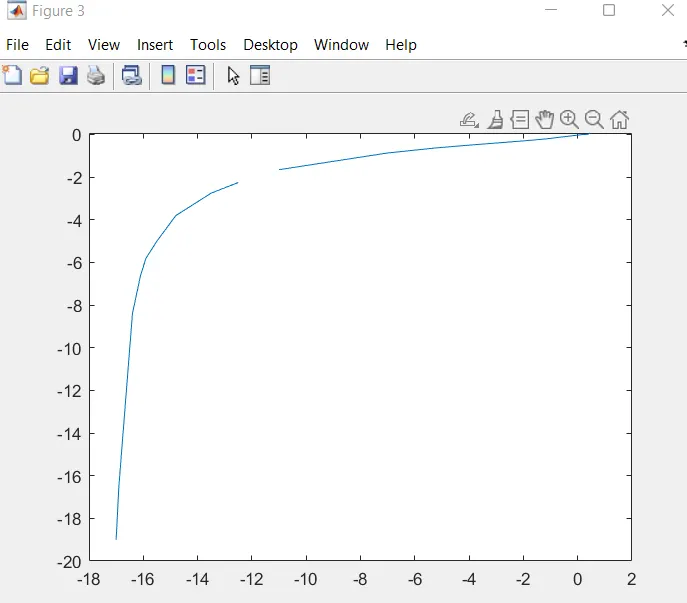
%Liner Interpolation
i12=interp1(v,i,v12)
figure (3)
%plot
plot(v12,i12)
OUTPUT: