Project - Data Handling and Interpolation
Interpolation:
Interpolation is a technique for adding new data points within a range of a set of known data points. You can use interpolation to fill-in missing data, smooth existing data, make predictions, and more.
clc
VI=xlsread('V&I.xlsx');
V=VI(:,1);
I=VI(:,2);
R1=-17.3:0.1:0.9;% interpolation in the range of -17.3:0.1:0.9.
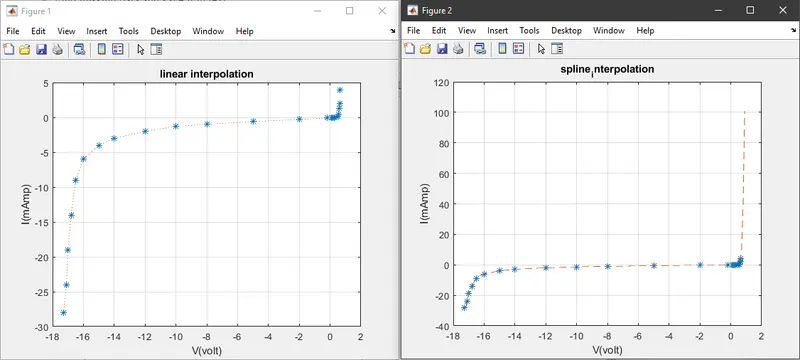
Iq1=interp1(V,I,R1);
Iq2=interp1(V,I,R1,'spline');
figure(1);
plot(V,I,'*',R1,Iq1,':');grid;xlabel('V(volt)');ylabel('I(mAmp)');
title('linear interpolation')
figure(2);
plot(V,I,'*',R1,Iq2,'--');grid;xlabel('V(volt)');ylabel('I(mAmp)');
title('spline_interpolation')