Project - Data Handling and Interpolation
Project - Data Handling and Interpolation
PROJECT :
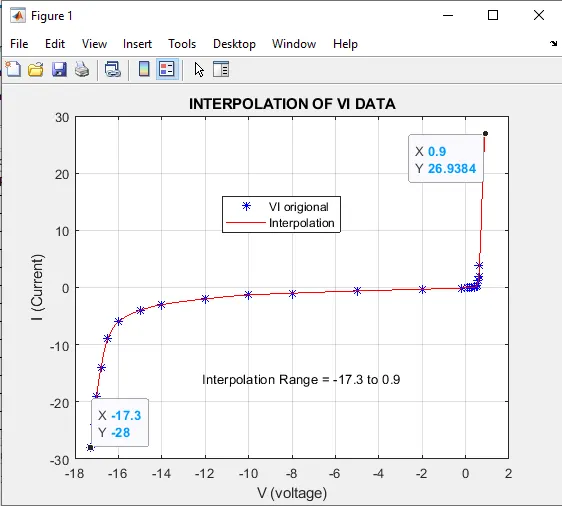
In a laboratory experiment, data of voltage and current has been recorded and the same is attached in an excel file ( Click on this link VI.xlsx ). Read the excel file in the Matlab program and perform the interpolation in the range of -17.3:0.1:0.9. Generate the interactive plot for the interpolated data and store them in a text file.
Key Highlights:
- Graphical solutions are more visual and appealing
- Interpolation of data
- Read excel file
- Write to text file
Deliverables:
- Find missing data and save it in text
- Interpolate the data set
- Save your program and attach the same.
- Save txt file and upload in attachment
SOLUTION CODE :
%% PROJECT
close all
clear all
clc

%% AS PER QUESTION - HERE WE IMPORT EXCEL DATA IN MATLAB :

V = xlsread('VI.xlsx',1,'A2:A25'); %IMPORT 1st coloumn V from excel sheet
I = xlsread('VI.xlsx',1,'B2:B25'); %IMPORT 2nd coloumn V from excel sheet
V1 = [-17.3:0.1:0.9];    % Set range from -17.3 to 0.9 with 0.1 interval
I1 = interp1(V,I,V1,'pchip') % Using interp1 for 2D interpolation
figure(1)
plot(V,I,'b*',V1,I1,'r-') % ploting interpolation with origional graph of VI
grid on;
xlabel('V (voltage)'); % Labeling
ylabel('I (Current)'); % Labeling
title('INTERPOLATION OF VI DATA');
legend('VI origional','Interpolation');
gtext('Interpolation Range = -17.3 to 0.9');

%% NOW AFTER GETTING INTERPOLATED VALUES , WE STORED THEM IN TEXT FILE
% CREATING TEXT FILE : 'Interpolated_data.txt'
fileID = fopen('Interpolated_data.txt','w');
fprintf(fileID,'%g \n',I1);
fclose(fileID);

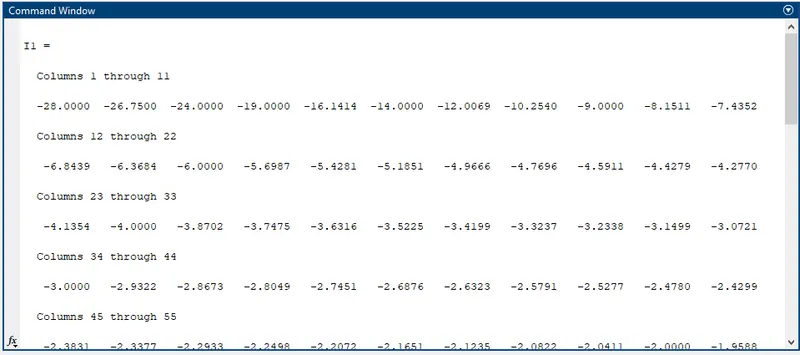
% NOW YOU CAN SEE INTERPOLATED VALUES IN COMMAND WINDOW AND TEXT FILE ALSO
OUTPUT PLOT :
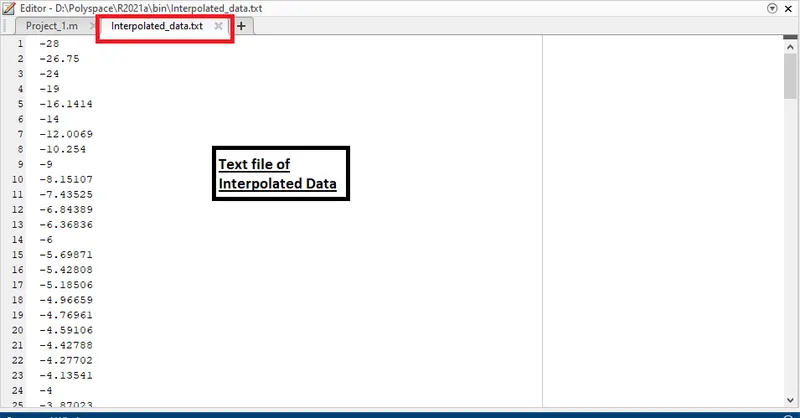
OUTPUT TEXT FILE PHOTO :
OUTPUT VALUES IN COMMAND WINDOW /PHOTO :
HERE I ATTACHED TEXT FILE : 'Interpolated_data.txt at attachment area
So Kindly check it also.