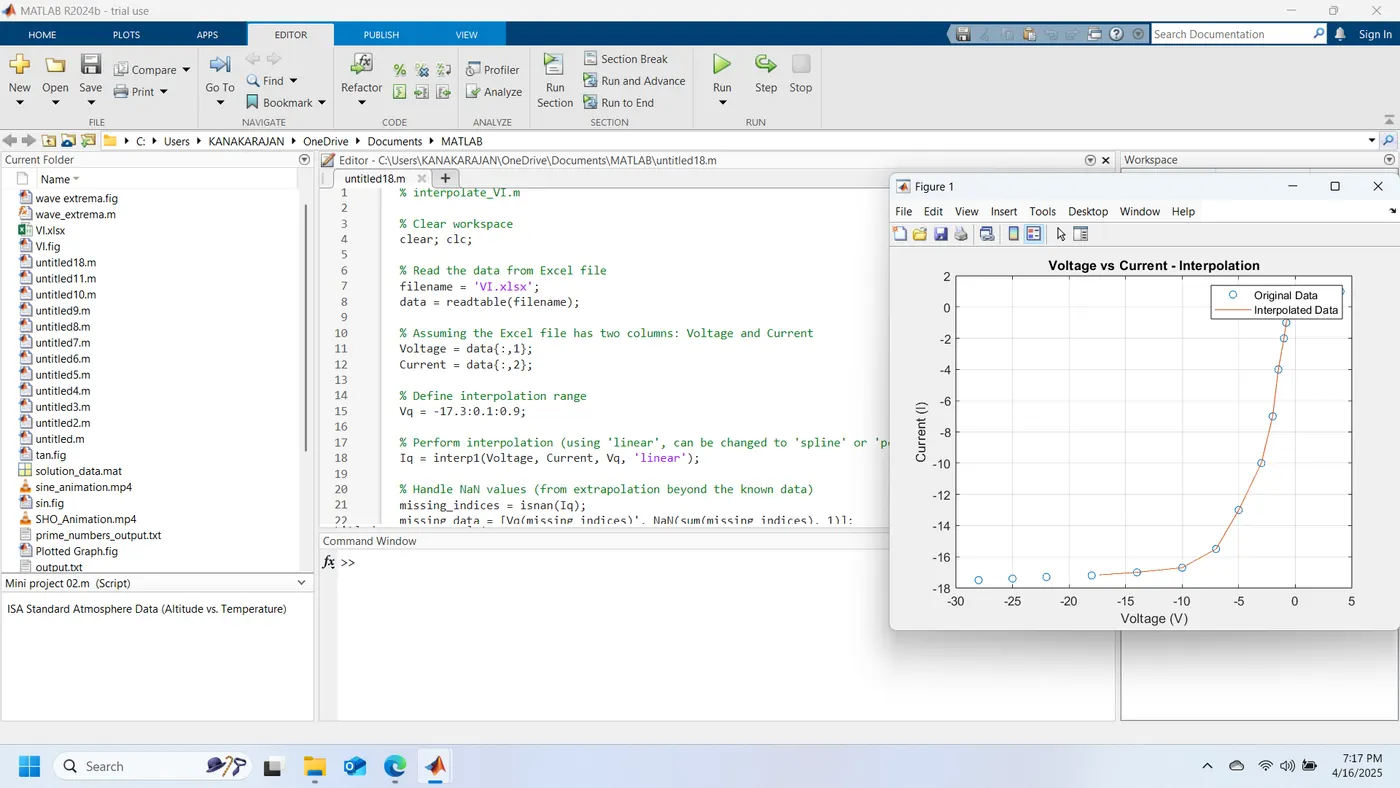
Project - Data Handling and Interpolation
% interpolate_VI.m
% Clear workspace
clear; clc;
% Read the data from Excel file
filename = 'VI.xlsx';
data = readtable(filename);
% Assuming the Excel file has two columns: Voltage and Current
Voltage = data{:,1};
Current = data{:,2};
% Define interpolation range
Vq = -17.3:0.1:0.9;
% Perform interpolation (using 'linear', can be changed to 'spline' or 'pchip')
Iq = interp1(Voltage, Current, Vq, 'linear');
% Handle NaN values (from extrapolation beyond the known data)
missing_indices = isnan(Iq);
missing_data = [Vq(missing_indices)', NaN(sum(missing_indices), 1)];
% Save interpolated data (excluding NaNs) to text file
InterpolatedData = [Vq(~missing_indices)', Iq(~missing_indices)'];
writematrix(InterpolatedData, 'InterpolatedData.txt', 'Delimiter', 'tab');
% Save missing data to text file
writematrix(missing_data, 'MissingData.txt', 'Delimiter', 'tab');
% Interactive Plot
figure;
plot(Voltage, Current, 'o', 'DisplayName', 'Original Data'); hold on;
plot(Vq, Iq, '-', 'DisplayName', 'Interpolated Data');
xlabel('Voltage (V)');
ylabel('Current (I)');
title('Voltage vs Current - Interpolation');
legend;
grid on;
% Optional: make interactive using MATLAB’s UI features