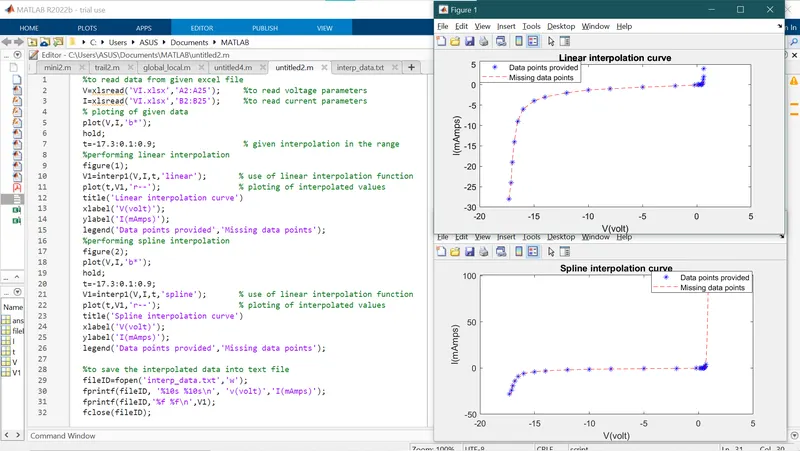
Project - Data Handling and Interpolation
Matlab Basic Project
Interpolation:
Script:
%To read dat from given excel file
V=xlsread('VI.xlsx','A2:A25'); %to read voltage data
I=xlsread('VI.xlsx','B2:B25'); %to read current data
%ploting of given data
plot(V,I,'b*');
hold;
t=-17.3:0.1:0.9; % given interpolation range
%performing linear interpolation
figure(1);
V1=interp1(V,I,t,'linear'); % use of linear interpolation function
plot(t,V1,'r--'); % ploting of interpolated values
title('Linear interpolation curve');
xlabel('V (volts)');
ylabel('I (Amps)');
legend('Data point provided', 'Misssing Data points');
% performing Spline interpolation
figure(2);
V1=interp1(V,I,t,'spline'); % use of spline interpolation function
plot(t,V1,'r--'); % ploting of interpolated values
title('Spline interpolation curve');
xlabel('V (volts)');
ylabel('I (Amps)');
legend('Data point provided', 'Misssing Data points');
% to save the interpolated values into text file
fileID=fopen('interp_data.txt','w');
fprintf(fileID,'%10s %10s\n', 'V (volts)', 'I (Amps)');
fprintf(fileID,'%f %f\n',V1);
fclose(fileID);
Result: