Project - Data Handling and Interpolation
AIM,
Read the excel file in the Matlab program and perform the interpolation in the range of -17.3:0.1:0.9. Generate the interactive plot for the interpolated data and store them in a text file.
PROCEDURE;
the following steps are followed to complete the given project
*Read the data from the excel file using "xlsread" command
>>P = xlsread('volatgecurrent.xlsx')
* After Reading the data from the Excel file we need to extract the Voltage and Current values seperately and assisgned the variables 'V' for volatge values and I for current values.
>>V = P(;1);
>>I = P(;2);
*Assigned a variables to the given range of limits data for interpolation
Vq=17.3:0.1:0.9.
The interpolation of voltage (V) and current (I) values interpolated with 'interp1' command with a given range of limits (vq).
>>iq=interp1(V,I,*r,Vq,Iq,b');
Add the grid ,x,y labels title and legend with their respect commands in the matlab
*The plotted results are as shoen below
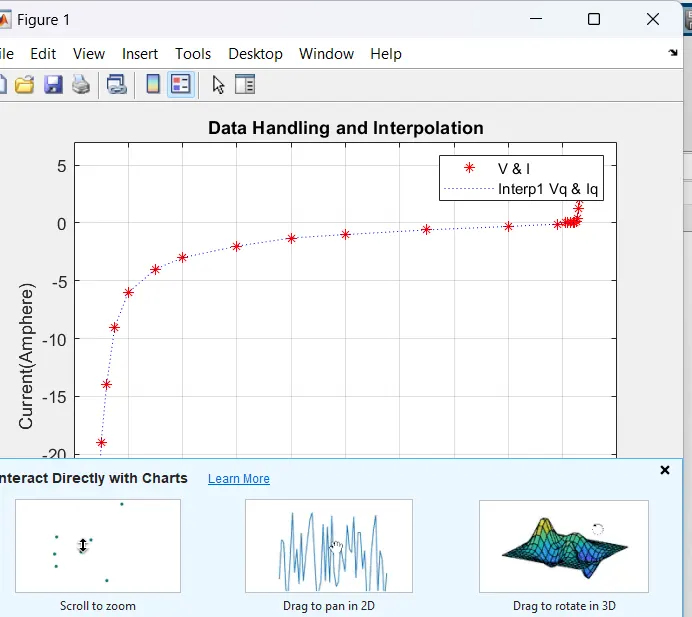
Actual volatge (v) and current(I) values with the interpolated values volatge(Vq) and current(Iq) are plotted
*Now we need to save the file interpolated data into a text file
Open the text file, 'matlab_project.txt' using the fopen "function in the parenttheses give the text file name and 'W'
to write the data into a text file,
After printing the data into a text file close the file 'fid' using fclose function
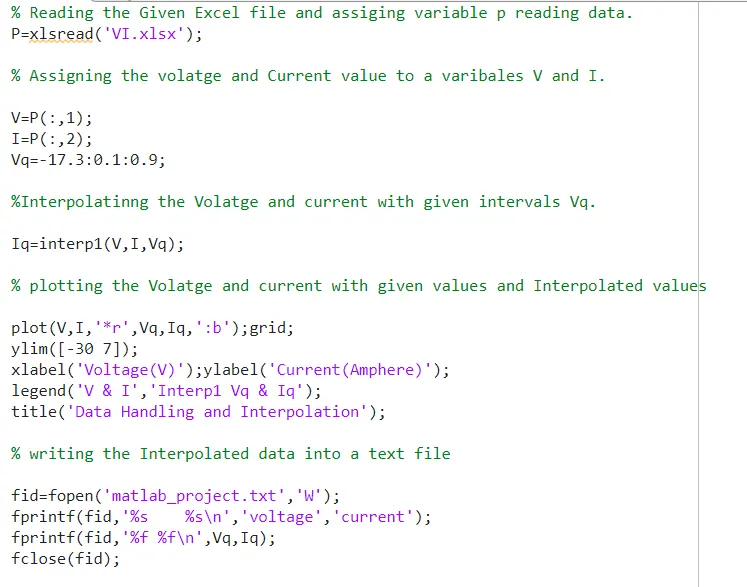
Matlab code for the project is as shown below;
CONCLUSION
The given Excel file is read using the matlab code and interpolated the data with a given range of limits and resulted values are plotted and saved intoma text file using the Matlab code and the supported files are attached