Project - Data Handling and Interpolation
ans-
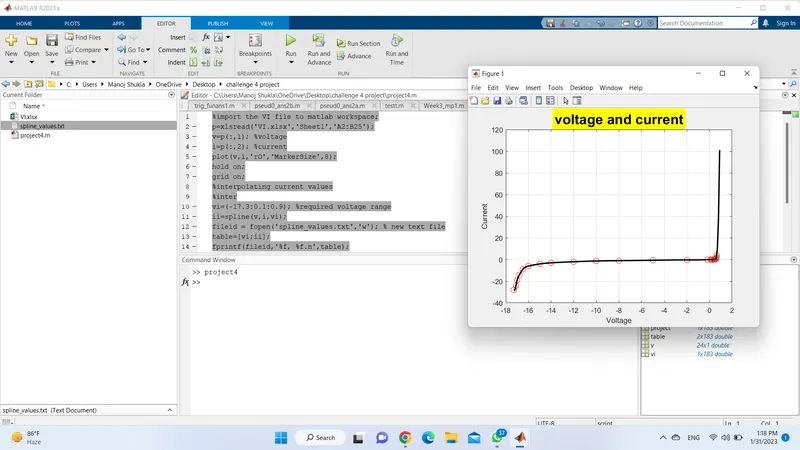
%import the VI file to matlab workspace;
p=xlsread('VI.xlsx','Sheet1','A2:B25');
v=p(:,1); %voltage
i=p(:,2); %current
plot(v,i,'rO','MarkerSize',8);
hold on;
grid on;
%interpolating current values
%inter
vi=(-17.3:0.1:0.9); %required voltage range
ii=spline(v,i,vi);
fileid = fopen('spline_values.txt','w'); % new text file
table=[vi;ii];
fprintf(fileid,'%f, %f.n',table);